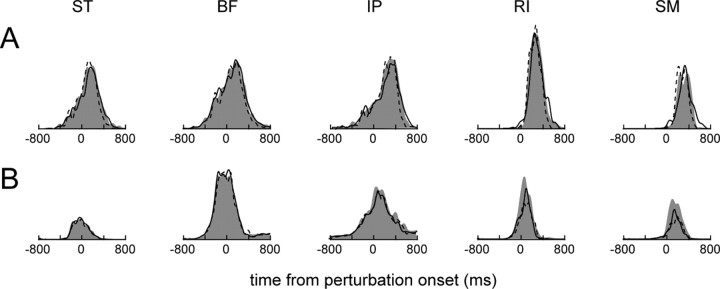
Figure 7.
The rectified, filtered, and averaged EMGs for two afferent-intact frogs (A and B) are shown. The average unperturbed trial EMGs are the filled gray regions, whereas the average counterclockwise perturbed trial EMGs and clockwise perturbed trial EMGs are indicated by dashed and solid black lines, respectively. Averages were computed after aligning trials on the perturbation onset.

