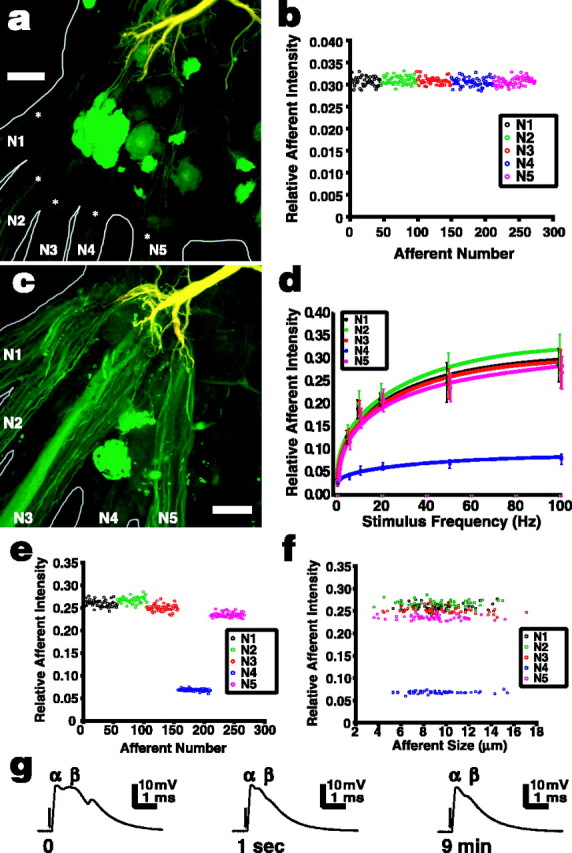
Figure 5.

Sensory nerve shock increases NB dye coupling from the LG to primary afferents in A6. The LG was injected with a pair of tracers, TR (red) and NB (green), which combined to make the LG appear yellow; cells that dye couple to the LG appear green. a, A preparation in which the LG was filled with the tracers but no additional stimulus was applied. The LG dendrites can be seen at the top of the micrograph, and the somata of dye-coupled motor neurons appear bright green [see Antonsen and Edwards (2003) for complete details of the anatomy]. The axons of primary afferents that dye coupled to the LG can be seen entering the ganglion from each peripheral nerve (asterisks), but they are quite faint in unstimulated preparations. b, Within a single preparation, NBF of afferents relative to LG was highly consistent independent of the location of the afferent (nerve). Afferents are plotted in the order they were measured and are color-coded to their nerve. See Materials and Methods for details on calculating relative afferent fluorescent intensity. c, Afferents appear much brighter in preparations that have been stimulated with N2 shocks; in this example, 20 Hz stimulation was applied for 10 min at an amplitude of 70% of the LG threshold voltage. d, Dye coupling between afferents in all nerves and the LG increased significantly with the frequency of N2 stimulation (Kruskal-Wallis test; p < 0.001 for each nerve). Points show means ± SD (n = 6). e, Relative afferent NBF intensity remained consistent among afferents of any given nerve after stimulation. This example is from a single preparation stimulated at 50 Hz. f, In the same preparation, relative afferent NBF intensity did not depend on afferent size (axon diameter). g, Intracellular recordings from the major dendrite of the LG near the initial segment show that the α component of the LG EPSP evoked by 20 Hz N2 stimulation remained constant over the stimulus period (times given are from start of stimulation), whereas the later β EPSP components quickly depress. This pattern was similar for each stimulus frequency. The arrows indicate the beginning of the stimulus, although the artifacts are too small to see on these traces. Scale bars, 50 μm.
