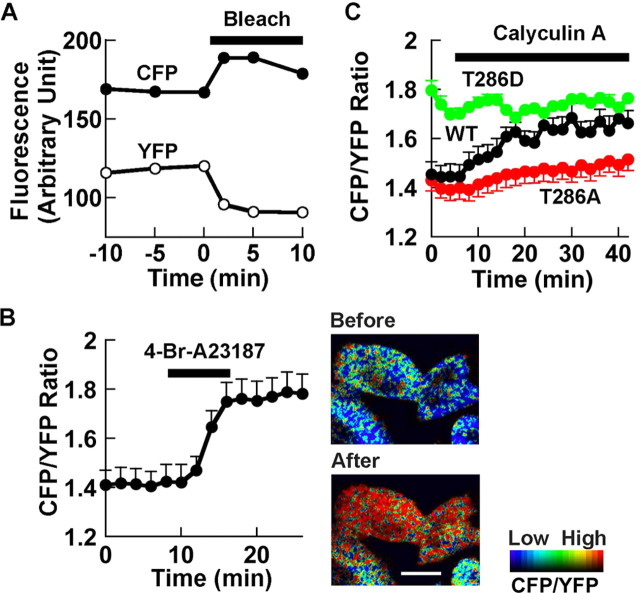
Figure 3.
Characterization of FRET of Camuiα in HeLa cells with two-photon laser-scanning microscopy. A, Acceptor bleaching to confirm FRET in cells. Average FRET efficiency was 17.8 ± 3.0% (n = 10). A typical example is shown. B, Effect of Ca2+ ionophore on FRET. FRET images of cells expressing wild-type Camuiα are shown to the right. Scale bar, 10 μm. n = 12. C, Effect of the phosphatase inhibitor calyculin A (1 μm). Wild type (WT), n = 4; T286A, n = 3; T286D, n = 5. Images are shown in intensity-modulated display mode, in which a warmer hue indicates a higher CFP/YFP ratio or lower FRET and brightness indicates that of CFP channel using MetaMorph (Universal Imaging, West Chester, PA). Error bars represent SEM.

