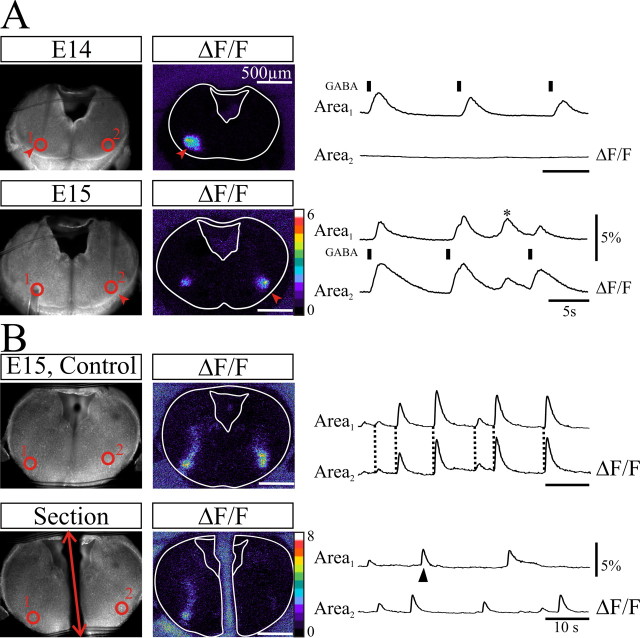
Figure 4.
The two ventrolateral HF generators are synchronized through commissural connections established at E15. A, Top, The left image shows an E14 transverse slice in fluorescence and ventrolateral areas (red circles 1, 2) where changes in fluorescence were monitored during pressure puff applications of GABA (50 ms, 0.1 Hz) at the surface of the slice in the vicinity of area 1 (red arrowheads and black bars above the area 1 trace). Note on the left image (ΔF/F) and on traces the confinement of the evoked calcium transients in the vicinity of the application site. Bottom, The same experiment performed on an E15 slice. GABA is applied in the vicinity of area 2 (red arrowheads). Note at E15 that the evoked response is bilateral and the presence of a spontaneous HF burst (*). The slower kinetics evoked calcium changes in area 2 compared with those in area 1 probably owe to persistence of GABA in the vicinity of the application site. B, Same organization of panels as in A showing spontaneous bilateral HF calcium transients in ventrolateral areas (red circles 1, 2) on control (top) and after section along the midline (red double-headed arrow). Note that the bilateral synchrony of calcium transients (dotted lines on top set of traces) is lost after the section, whereas the ability to generate HF bursts is preserved in each hemislice. The ΔF/F image was taken at the time indicated by the arrowhead under the area 1 trace. Scale bars, 500 μm.

