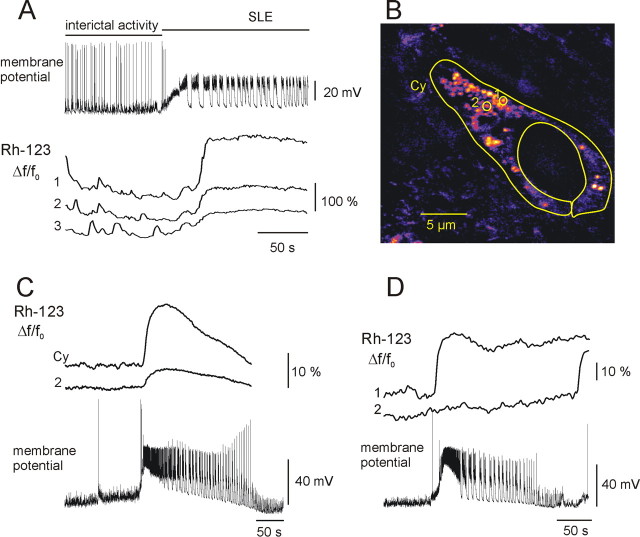
Figure 4.
Changes in ΔΨm during seizure-like events. A, Rh-123 fluorescence changes in dendrites during transition from interictal activity to SLE from the same cell shown in Figure 3A. Independent Rh-123 fluorescence fluctuations (bottom) during interictal activity were followed by a simultaneous increase in the fluorescence. Note that the maximal depolarization of mitochondrial membranes occurred during the CLADP. B, An Rh-123-filled pyramidal cell indicating the position and shape of the cytosolic (Cy) and mitochondrial (1 and 2) ROIs, used for Rh-123 fluorescence monitoring in C and D. C, SLE-associated changes in Rh-123 fluorescence, as measured in the cytosol and in mitochondria. Rh-123 fluorescence in the cytosol increased to a plateau during the TLP, followed by a slow recovery during the CLADP (supplemental time-lapse movie is available on-line at http://www.medichem.hu/mito/index.html). Mitochondrial fluorescence followed the same pattern (2), although the relative amplitude was smaller as basal mitochondrial fluorescence intensity (F0) was higher. D, Changes in Rh-123 fluorescence in somatic mitochondria after five SLEs. In 1 of 17 cases, a few mitochondria underwent abrupt depolarization during an SLE, as revealed by the sudden large-amplitude elevation of Rh-123 fluorescence.

