
Figure 6.
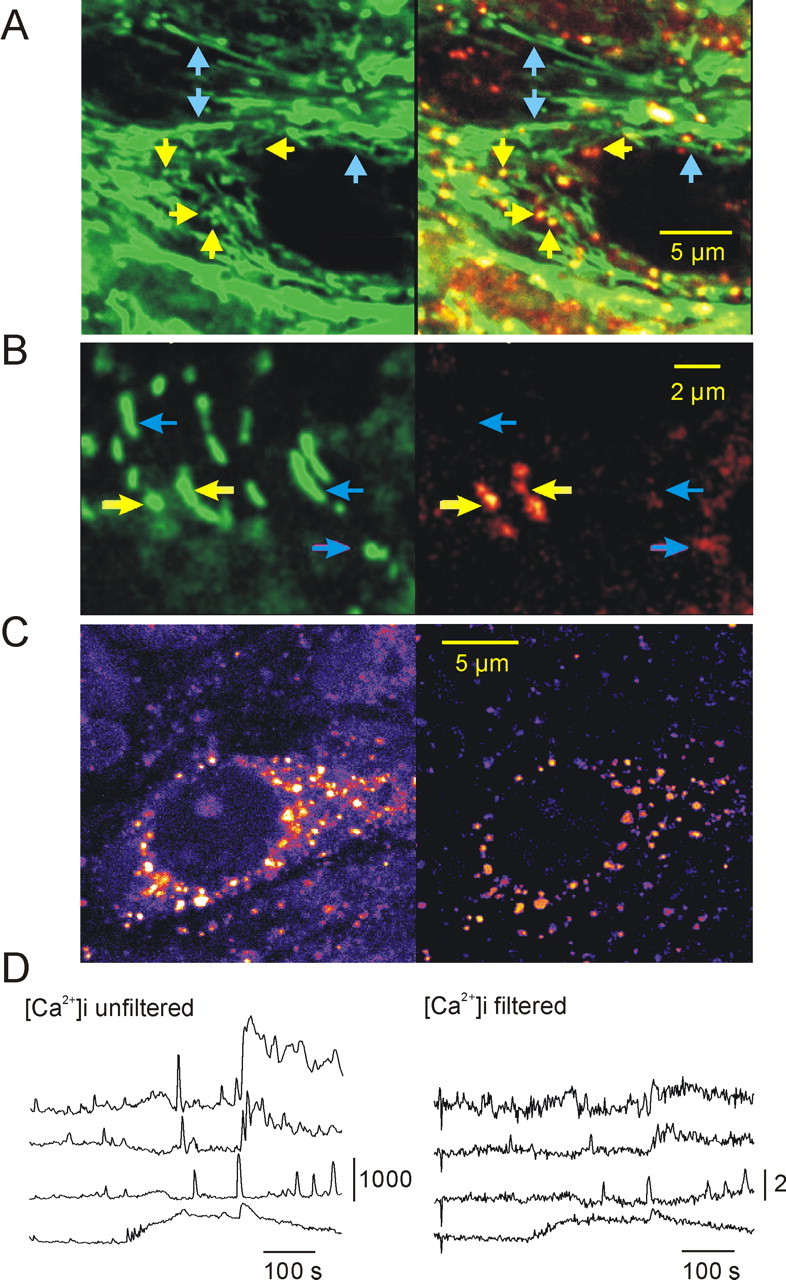
Differentiation between [Ca2+]m and [Ca2+]i in rhod-2-stained hippocampal slice cultures. A, Colocalization of the mitochondria-specific fluorescent marker MitoTracker Green (green fluorescence channel; A, B, left) and rhod-2 fluorescence (red fluorescence channel). On the superimposed picture (A, B, right), mitochondria with high resting [Ca2+]m are shown in yellow, and those with low [Ca2+]m are shown in green, whereas red represents the cytosolic Ca2+ ion level. A, B, Yellow and blue arrows point to mitochondria with high [Ca2+]m and low [Ca2+]m, respectively. B, MitoTracker Green-stained (green fluorescence channel) and rhod-2-stained (red fluorescence channel) mitochondria at a higher magnification. The high-[Ca2+]m spots within the elongated structures indicate that they may represent aggregates of several mitochondria. C, Spatial frequency-based image analysis (see Materials and Methods) for differentiation of mitochondrial and cytosolic fluorescence. The soma of a CA3 pyramidal cell (left) taken from the area CA3 of a rhod-2-stained slice culture is shown. The same cell is shown after bandpass filtering (right), displaying exclusively mitochondria. D, Effect of the bandpass filtering on the rhod-2 fluorescence transients. The traces on the left display [Ca2+]i transients as measured in the nucleus in four different cells during SLEs. The traces on the right represent [Ca2+]i changes measured in the same ROIs after filtering. To see the effect of bandpass filtering on the fluorescence intensity, the calibration bar of the traces represents absolute fluorescence intensity in arbitrary units (0-4096) instead of ΔF/F0 (supplemental time-lapse movies demonstrating the effect of filtering are available on-line at http://www.medichem.hu/mito/index.html).