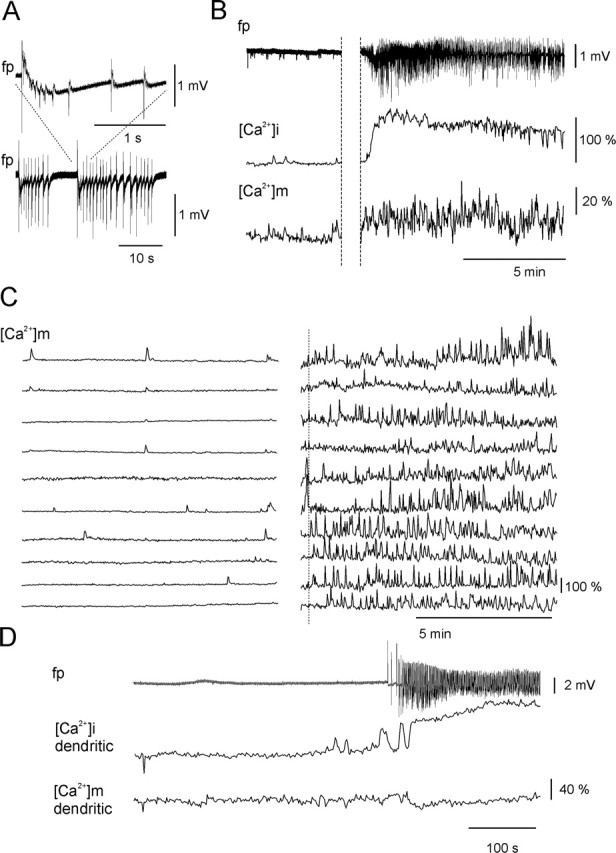
Figure 7.

Changes in rhod-2 fluorescence during SLEs. A, Field potential (fp) recording during SLEs revealed recurrent synchronous population discharges. B, Time course of field potential, [Ca2+]i, and [Ca2+]m transients during interictal activity (left) and during an SLE (right). The [Ca2+]i accumulation was associated with an increase in the amplitude of the [Ca2+]m fluctuation (averaged from the 10 mitochondria shown in C) during SLE. C, [Ca2+]m fluctuations as measured in individual mitochondria in the soma and dendrites during interictal activity (traces on the left) and an SLE (traces on the right). The onset of the SLE is marked with a dotted line (supplemental time-lapse movies are available on-line at http://www.medichem.hu/mito/index.html). D, Block of [Ca2+]m transients by Ru360. Blockade of the mitochondrial Ca2+ ion uniporter by Ru360 left the dendritic [Ca2+]i transients unaltered (middle trace), whereas SLE-associated [Ca2+]m transients were absent in the mitochondria from the same dendrite (bottom trace). The remaining fluctuations were solely attributable to mitochondrial Brownian motion. Ru360 was continuously present in the perfusion.
