
Figure 7.
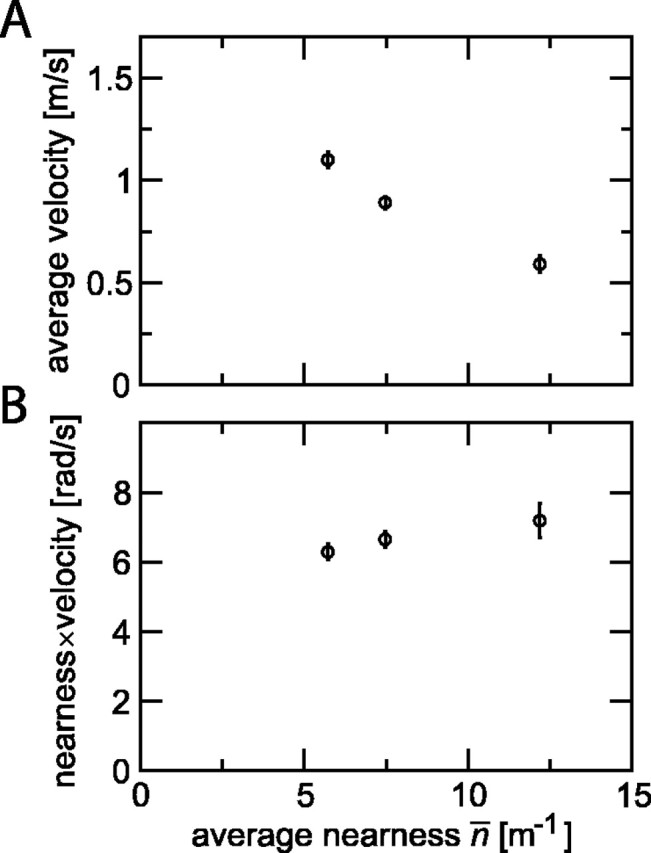
Flight velocity and translational optic flow as a function of tunnel size. A, Average velocity for crossing a tunnel of 20 cm height and width of 9, 18, or 36 cm plotted as a function of average nearness. B, Average nearness times average velocity as a function of average nearness. For both graphs, data points show average (±SEM) of 62 flights of 11 flies (W = 36 cm; n̄ = 5.7 m-1), 61 flights of 11 flies (W = 18 cm; n̄ = 7.5 m-1), and 20 flights of 5 flies (W = 9 cm; n̄ = 12.2 m-1). Velocity was defined here as Δs/Δt, where Δt is the time difference between crossing the entrance and exit planes of a tunnel segment of length Δs = 0.8 m. rad/s, Radians per second.