Figure 1.

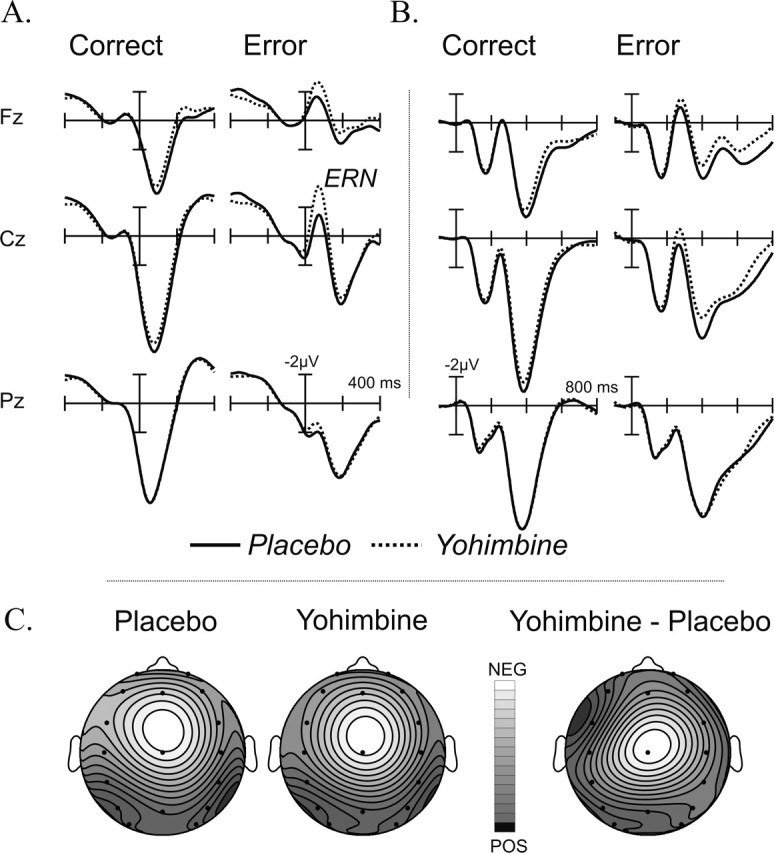
A, Response-locked ERPs depicted for correct and erroneous responses in each treatment condition (placebo and yohimbine). Note the increased negativity just after the commission of the errors (ERN component) and the larger ERN observed after yohimbine. B, Stimulus-locked ERPs show a broad increase in negativity in the yohimbine condition, just after the peak of the N2 component, which is followed by a reduced central positivity superimposed over the P3 component. C, Topographical maps for the ERN component in both treatment conditions using isovoltage spline interpolation for the 50-100 ms interval. Relative scaling was used. Minimum and maximum values for each isovoltage map are as follows: placebo, -3.29/1.9 μV; yohimbine, -4.9/1.68 μV; yohimbine minus placebo, -1.69/0.08 μV.
