
Figure 1.
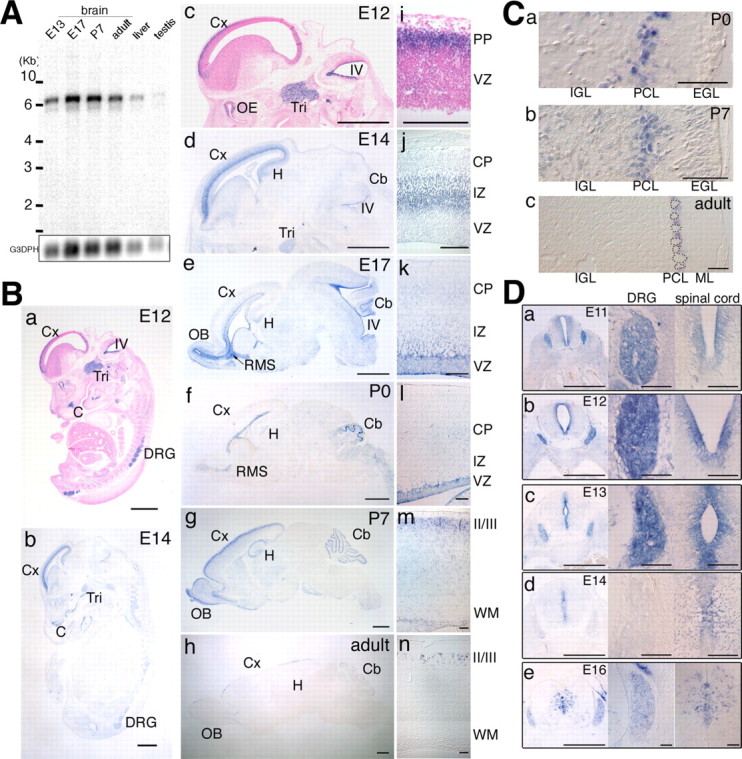
Expression of the P-Rex1 gene in the developing mouse brain. A, Northern blot analysis of murine P-Rex1 expression. Each lane contains 2 μg of poly(A+) RNA from mouse brains (E13, E17, P7, and adult), adult liver, and adult testis. Bars located to the left of the panel indicate 10, 6, 4, 3, and 2 kb, respectively. The same blot was reprobed with glyceraldehyde-3-phosphate dehydrogenase (G3PDH) cDNA as a control (bottom). B, Sagittal sections of E12 and E14 embryos (a, b) or of brains from E12 to adult (c-h) were hybridized with the mouse P-Rex1 cRNA probe. Samples in a and c were counterstained with nuclear fast red. Cx, Cerebral cortex; IV, fourth ventricle; Tri, trigeminal ganglion; C, cartilaginous tissue; DRG, dorsal root ganglion; OE, olfactory epithelium; Cb, cerebellum; H, hippocampal formation; RMS, rostral migratory stream; OB, olfactory bulb. Scale bars, 1.0 mm. i-n, Higher-magnification images of c-h around the cerebral cortices. PP, Preplate; VZ, ventricular zone; CP, cortical plate; IZ, intermediate zone; WM, white matter; II/III, the layers of the cerebral cortex. Scale bars, 100 μm. C, Distribution of P-Rex1 transcripts in the cerebellum. a-c, Higher-magnification pictures of the cerebellum in Bf-Bh. P-Rex1-positive signals were restricted in the Purkinje cell layer. Cells demarcated with dotted lines in c are Purkinje cells. Scale bars, 100 μm. D, Distribution of P-Rex1 transcripts in the spinal cord and DRG. a-e, Coronal sections of E11-E16 embryos at the lumbar level in the spinal cord were hybridized with the P-Rex1 cRNA probe (left panels). Middle and right panels are enlarged images of DRGs and central regions of spinal cords, respectively. Scale bars: left panels, 500 μm; middle and right panels, 100 μm.