
Figure 7.
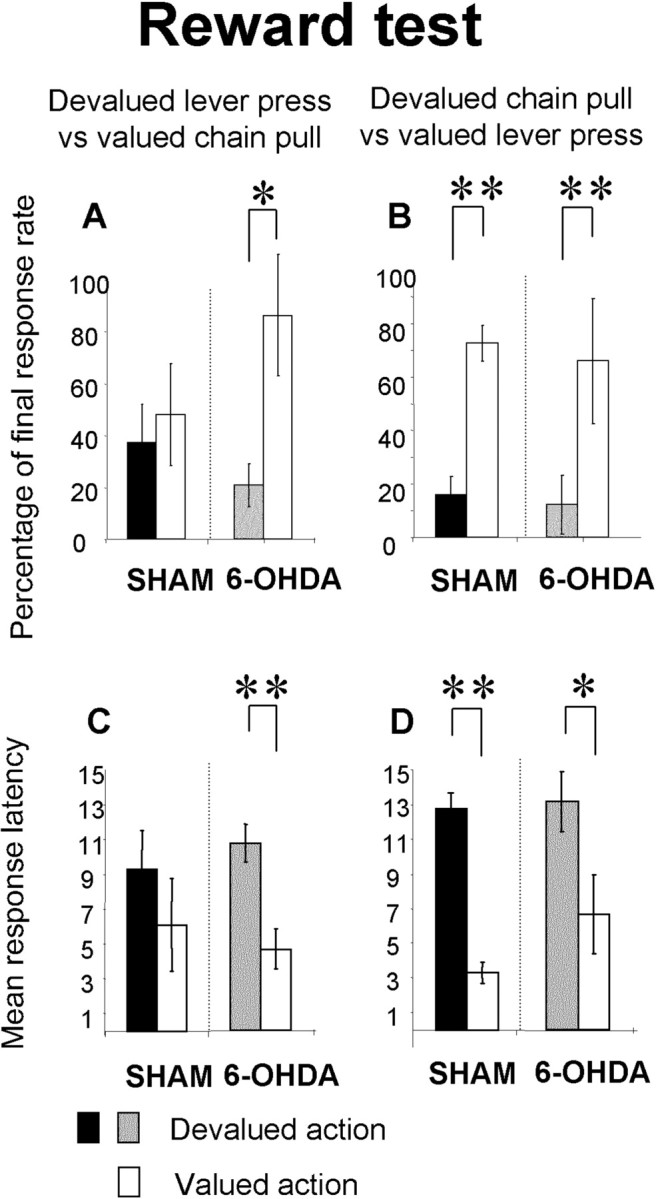
Reward test. The mean percentage of the final response rate during the stimulus (A, B) and mean latency of the first action to the stimulus (C, D) for the devalued lever press group (A, C) and the devalued chain pull group (B, D) are shown. Gray and black bars represent the mean percentage or latency of the devalued action for the 6-OHDA-injected and sham groups, respectively. Open bars represent the mean percentage or latency of nondevalued action in sham and 6-OHDA-injected rats. Note that the lever press is not sensitive to outcome devaluation for sham animal either on the percentage or on the latency. In contrast, for 6-OHDA-injected animals, the mean percentage of lever press to the stimulus and latency are sensitive to the outcome devaluation. In contrast, the chain pull (percentage or latency) is sensitive to the outcome devaluation in sham as in 6-OHDA-injected animals. Data are expressed as means ± SEM. *p < 0.05; **p < 0.01.