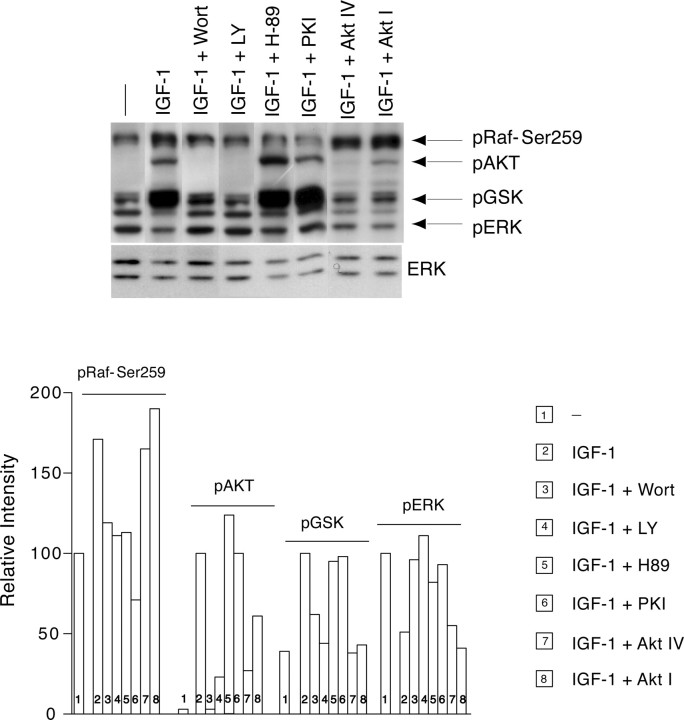
Figure 9.
Specificity of W (100 nm), LY (50 μm), H89 (5 μm), PKI (20 μm), Akt-IV (10 μm), and Akt-I (10 μm) on IGF-1-induced pRaf-Ser259, Akt, and GSK, and on ERK inhibition. Western blotting was performed after 9 h of administration of IGF-1 together with inhibitors. The blot was probed with antibodies to pRaf-Ser259 and pERK followed by antibodies to pAkt and pGSK. The bottom panel indicates the relative intensity of the bands.

