
Figure 3.
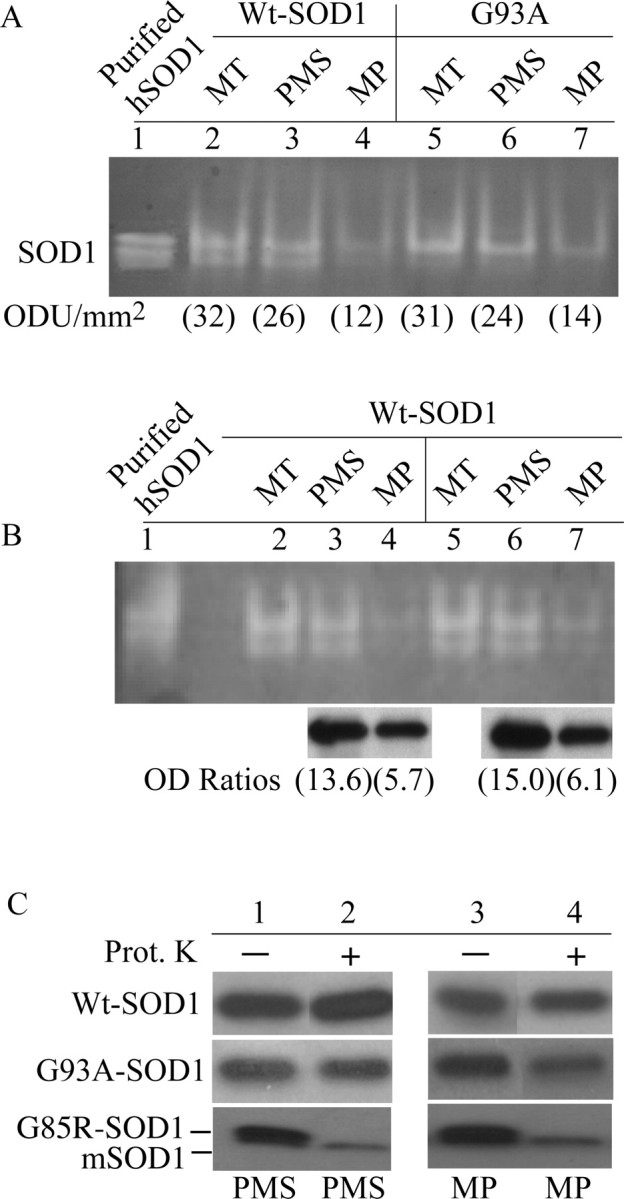
hSOD1 associated with brain mitoplasts is enzymatically impaired. A, Distribution of SOD1 enzymatic activity in brain mitochondria from Wt and mutant G93A hSOD1 transgenic mice. Purified mitochondria (MT) were subfractionated into PMS and MP fractions and were analyzed using an activity gel assay, as described in Materials and Methods. Lane 1, Purified hSOD1 was used as a positive control. Numbers in parentheses are band signal intensities of SOD1 activity [in optical density units (ODU) per square millimeter]. B, Quantification of the relative SOD1 activity in brain MT, PMSs, and MPs from two Wt mice. SOD1 activity was quantified in-gel as in A. Lane 1, Purified hSOD1 was used as a positive control. SOD1 activities in PMSs and MPs were normalized by the density of SOD1 bands detected by Western blot in aliquots from the same samples (optical density ratios). Numbers in parentheses are optical density ratios (OD Ratio; in arbitrary units). C, PK (Prot. K) treatment of subfractionated mitochondria. The same PMS (lanes 1, 2) and MP (lanes 3, 4) fractions shown in A were treated with or without 200 μg/ml PK for 180 min at room temperature, followed by protease inactivation with 1 mm PMSF and 4% SDS sample buffer. Western blots were immunoprobed for SOD1. Endogenous murine SOD1 (mSOD1) was not PK sensitive.