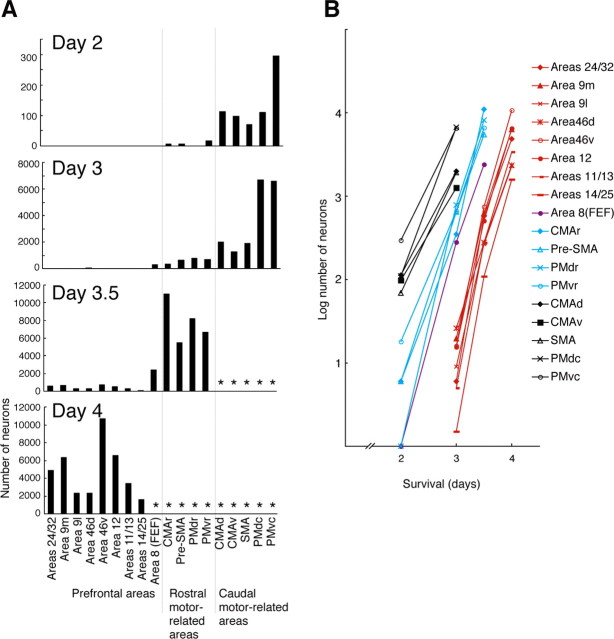
Figure 7.
A, Diagrams showing the time-dependent changes in the number of labeled neurons in the frontal lobe. Cell counts were performed in every 12th section (60 μm thick; 720 μm apart). The cell number obtained at the 3, 3.5, or 4 d postinjection period is the average of data in monkeys Hu and Ke, Ir and Ta, or No and Ji, respectively, whereas the cell number at the 2 d postinjection period is taken from monkey Ma (see Table 1). Asterisks indicate the areas in which cell counts were not performed, because a tremendous number of neurons were labeled at the 3.5 and 4 d postinjection periods. B, Exponential increases in labeled neuron number with the postinjection period. The ordinate indicates the logarithm for the number of labeled neurons in each area. Black symbols represent the caudal motor-related areas, blue symbols represent the rostral motor-related areas, and red symbols represent the prefrontal areas. Filled purple circles represent area 8 (FEF). 9l, Lateral area 9; 9m, medial area 9; 46d, dorsal area 46; 46v, ventral area 46. Numbers correspond to the area numbers defined by Barbas and Pandya (1989).

