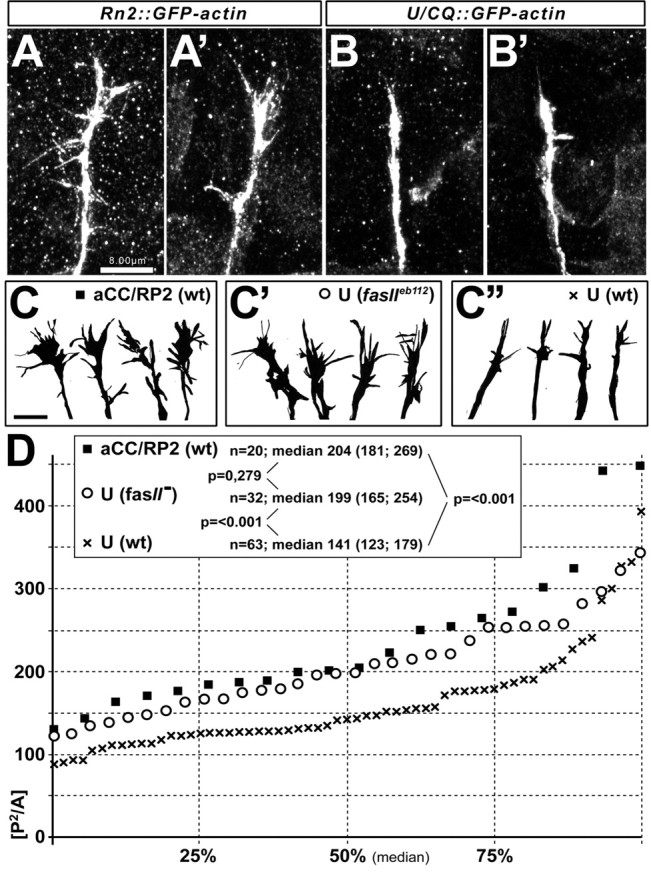
Figure 6.

Shapes of growth cones distinguish pioneers from followers and are influenced by FasciclinII. Whereas growth cones of aCC/RP2 neurons show numerous filopodia (A, A′, C), growth cones of U neurons are narrow and poor in filopodia (B, B′, C″; visualized with Rn2-Gal4- or U/CQ-Gal4-driven GFP-actin, respectively). Camera lucida drawings of growth cones (C-C″) were obtained from aCC/RP2 neurons in wild type (wt) (C, black square), U neurons in fasciclinIIeb112 loss-of-function mutant background (fasII) (C′, circle), or U neurons in wild-type embryos (C″, black cross). Their complexity index, P2/A, is plotted as a graph in D showing the median at 50% and interquartile ranges at 25 and 75%; the box in D contains sample numbers of measured growth cones (n), values of the respective medians (interquartile ranges in brackets separated by a semicolon), and significance values (p) obtained by Mann-Whitney rank sum tests (comparing the respective groups indicated by lines). Whereas U growth cones are significantly less complex than those of aCC/RP2 neurons in wild-type background, they are similarly complex in fasciclinIIeb112 mutant background. Scale bars, 8 μm.
