Figure 5.
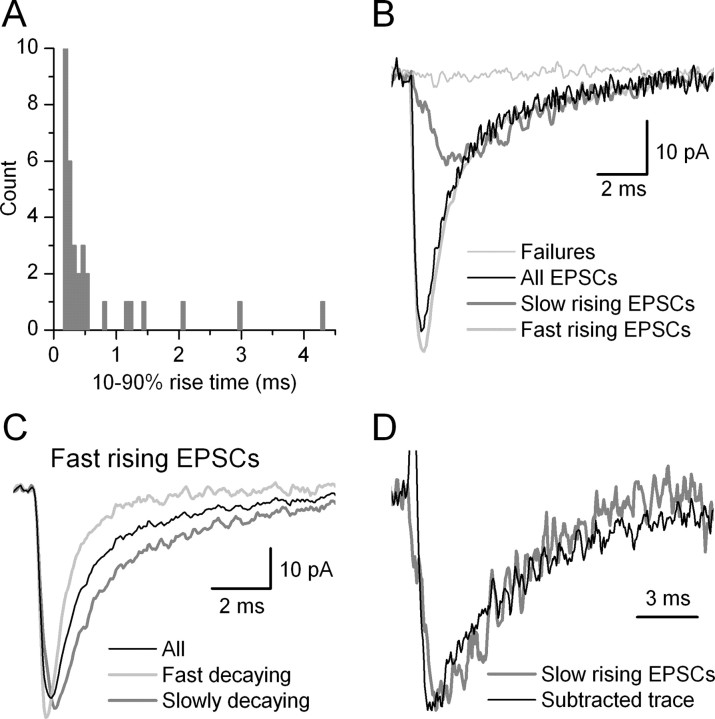
Kinetic properties of unitary EPSCs evoked by a PC on an IN. A, Distribution of 10-90% RTs of successful events evoked by the 16th AP of the presynaptic train (pair, AB377; same as shown in Fig. 3). The distribution is skewed toward larger values. Most of the EPSCs had a 10-90% RT <500 μsec, but seven events showed an RT >0.7 msec. The distribution suggests more than one population of events according to their rise times. B, Superimposed averaged traces with different kinetics. The average of failures is shown in gray and that of all EPSCs is black. Successful events were grouped according to their 10-90% RTs (A), and the averaged traces are shown in gray and light gray thick traces. C, Fast-rising EPSCs were grouped according to their decay times to fast- and slow-decaying events. The 10-90% RTs of the two groups were slightly different (fast decaying, 0.18 msec; slow decaying, 0.37 msec) and their amplitudes were almost identical (fast decaying, 56.4 pA; slow decaying, 55.2 pA), but their weighted decay time constants differed markedly (fast decaying, 0.88 msec; slow decaying, 2.7 msec). D, The decay kinetics of the slow-rising EPSCs (gray trace) is compared with the arithmetic difference between the fast-rising, slow-decaying and fast-rising, fast-decaying EPSCs (black trace). The decay of the two traces overlaps well, indicating that the fast-rising, slow-decaying events are the superimposition of slow-rising and fast-rising fast-decaying EPSCs. The peak amplitudes of the traces were normalized.

