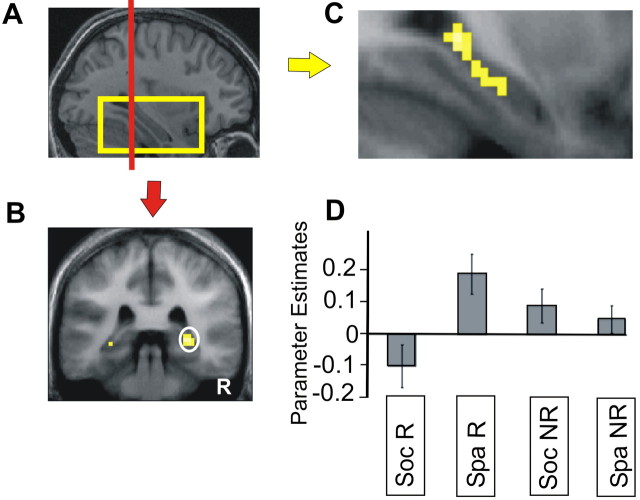
Figure 2.
Interaction effect of domain and task. A, Sagittal section from the structural MRI scan of one subject chosen at random. The yellow box outlines the region displayed in C. The red line indicates the location of the coronal section in the next panel. The threshold is set at p < 0.001, uncorrected. B, Coronal section at the level of the peak in right posterior hippocampus. Smaller left hippocampal activation is also evident. R, Right side of the brain. C, Sagittal view showing the extent of activation in the posterior and body of the right hippocampus. D, Condition-specific parameter estimates (betas) in arbitrary units averaged across subjects, relative to the baseline task at a representative voxel in the center of cluster in right hippocampus. Bars represent the SE. Soc R, Social relational; Spa R, spatial relational; Soc NR, social nonrelational; Spa NR, spatial nonrelational.

