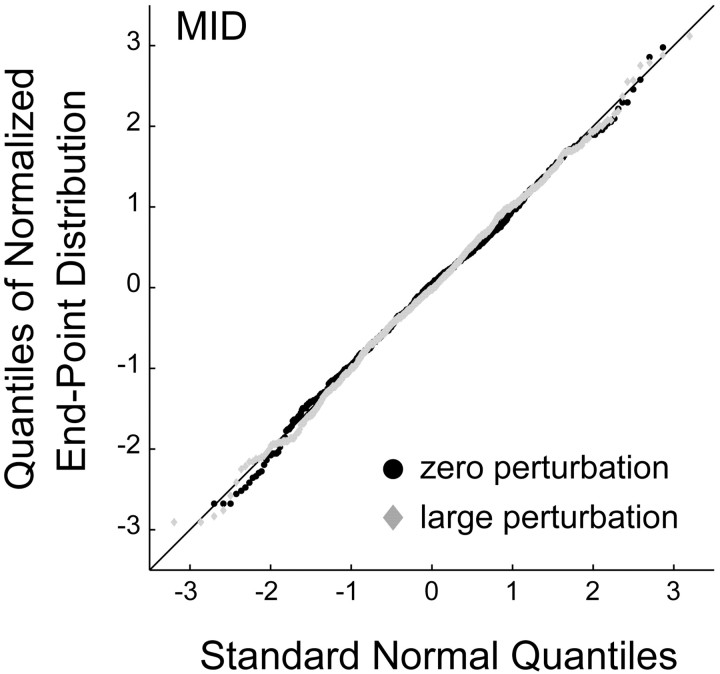
Figure 3.
Distribution of task-relevant variability. Quantile-quantile plots (Gnanadesikan, 1997;Rencher, 2002) of subject MID's task-relevant movement end points. Black corresponds to end points with zero perturbation, and gray corresponds to end points with large perturbation (720 data points per condition; data pooled across x and y directions; data for subject MID with zero perturbation were collected in sessions 2-4, and data for large perturbation were collected in sessions 8-10).

