Figure 4.
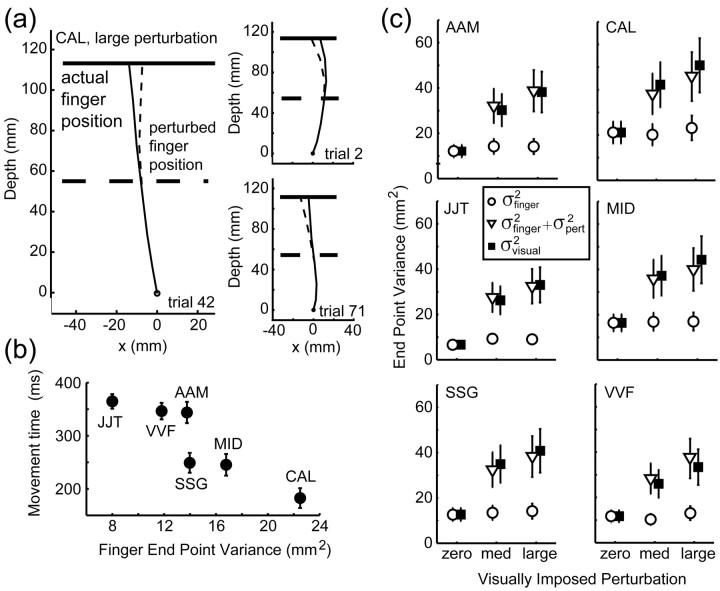
Effect of perturbation on finger position. a, Trajectories of actual (solid line) and perturbed (dashed line) finger position of subject CAL during individual trials (trials 2, 42, and 71 in the large perturbation condition). b, Correspondence between variance of the actual finger position and movement times (variance estimates averaged across all conditions per subject). c, Effect of varying the perturbation for each subject. Filled squares represent the measured variance  of the perturbed cursor position, open circles represent the measured variance of the actual finger position
  , and open triangles represent the sum of the variance of the actual finger position and of the applied perturbation
  . The sum of the two variances is similar to the values of
  , indicating that subjects did not compensate for the added perturbation. (Variance estimates are based on 720 data points per level of perturbation; data were pooled across x and y directions. Error bars indicate SEM for averaging variances across the 36 conditions.)

