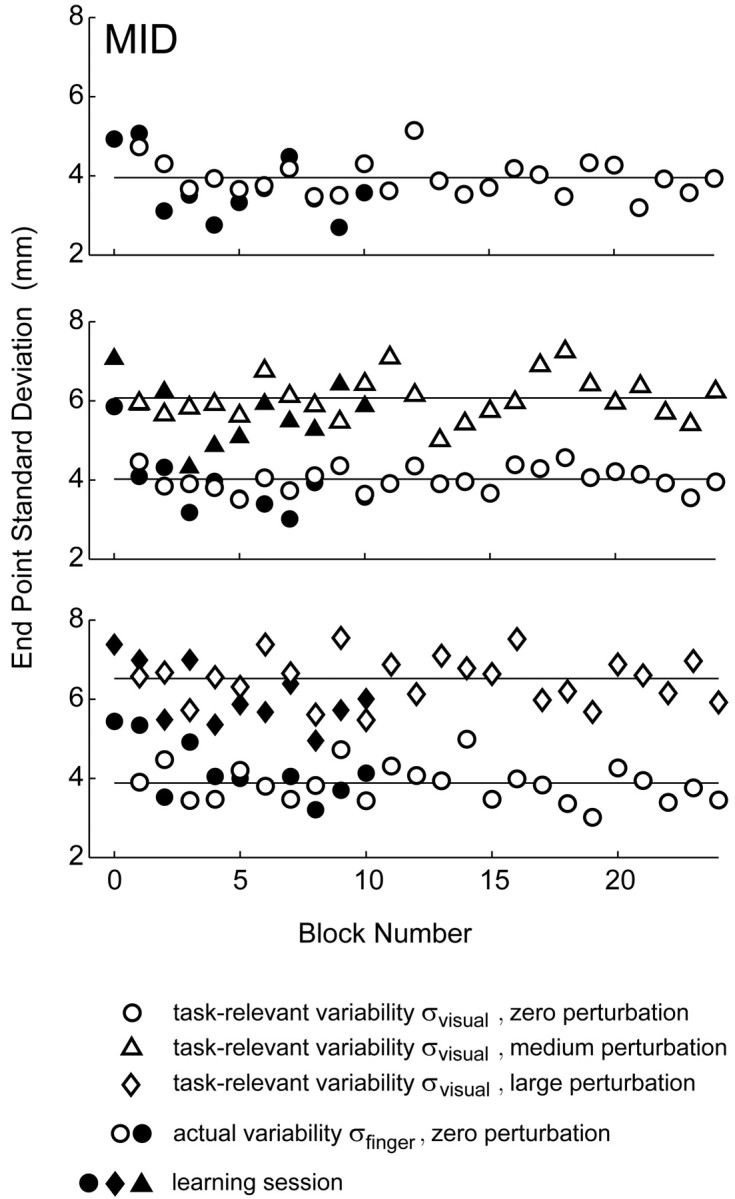
Figure 7.

Stability and distribution of task-relevant variability. Task-relevant ( ) and actual (
 ) movement variability (expressed as SDs) as a function of block number. Filled symbols indicate data from blocks in the learning sessions; open symbols indicate data from subsequent blocks in the experimental sessions (block number 0 corresponds to the first 32 trials in the learning session). In the plots corresponding to conditions with added noise, the circles indicate σfinger, and the triangles and diamonds indicate σvisual.
