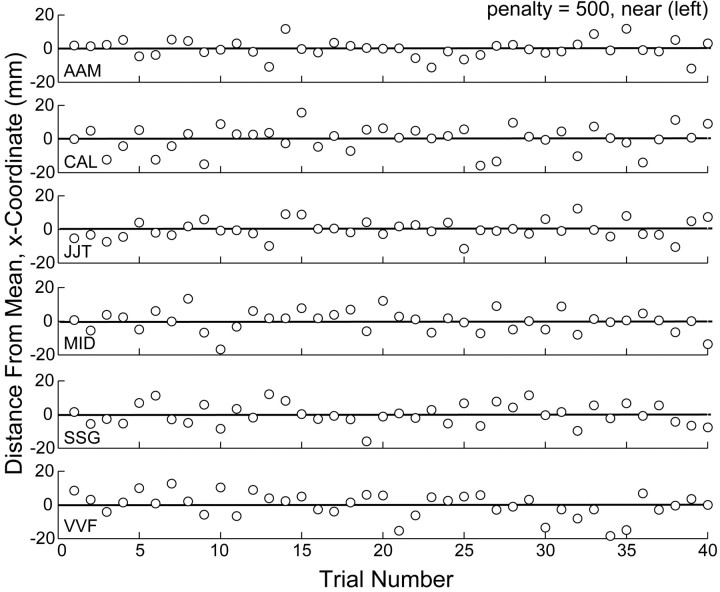
Figure 8.
Trial-by-trial data. Deviations of movement end points (x coordinate) from the mean (solid line) as a function of trial number are shown. Data are shown for all six subjects in the penalty = 500, near condition (in the condition in which the target was to the left of the penalty region), starting from the first trial in which the subject was exposed to the configuration.

