Figure 5.

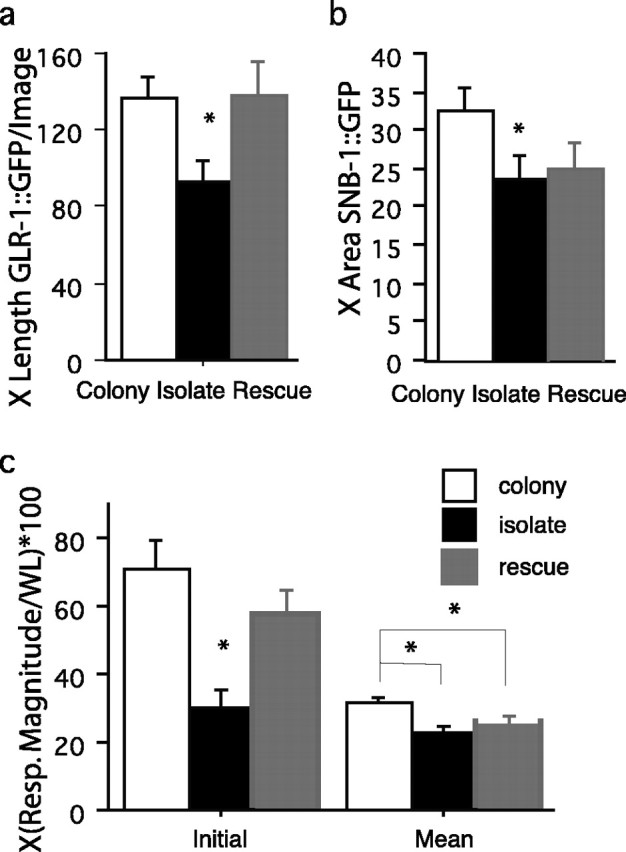
Effects of brief stimulation at L3 on presynaptic and postsynaptic terminals. a, Mean length of GLR-1::GFP expression per image in the ventral nerve cord for colony-raised (n = 26), isolate-raised (n = 20), and L3 stimulated isolate-raised (n = 19) worms. Isolate-raised worms showed significantly less GFP expression than either stimulated isolate-raised or colony-raised worm. b, Mean area of pmec-7::SNB-1::GFP expression in the ventral nerve cord for colony-raised (n = 20), isolate-raised (n = 17), and L3 stimulated isolate-raised (n = 11) worms. Both isolate-raised worms and stimulated isolate-raised worms showed significantly less SNB-1::GFP expression than colony-raised worms. c, When colony-raised (white bars; n = 31), isolate-raised (black bars; n = 36), and L3 stimulated isolate-raised (gray bars; n = 35) worms were given 30 stimuli at a 10 s ISI the results showed that stimulated isolates were not the same as colony worms. The first set of three bars (initial) shows the initial response ± SE to tap. Here, the isolate worms gave significantly smaller responses than either colony or stimulated-isolate worms. The second set of bars (mean) represents the mean ± SE of responses to 30 stimuli delivered at a 10 s ISI. These data show that colony worms gave significantly larger responses than did either stimulated isolate or isolate worms. There were no differences between the stimulated isolate and the isolate groups. The asterisks represent the group that differs significantly from the other two groups on the figure. Resp. Magnitude, Response magnitude; WL, worm length.
