
Figure 5.
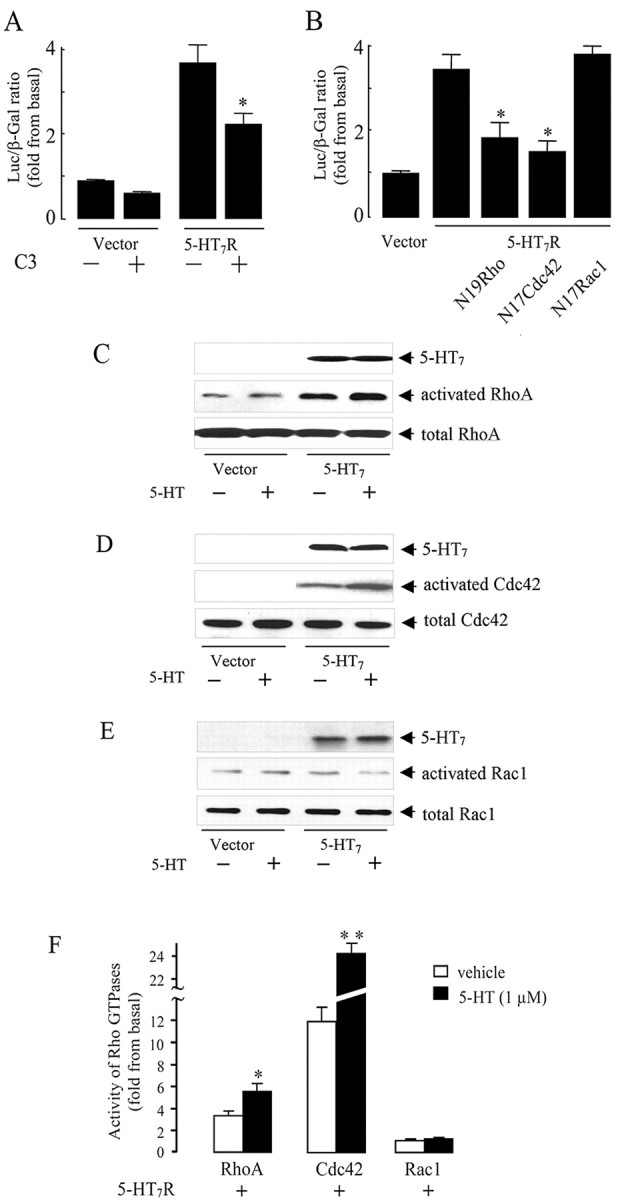
The 5-HT7 receptor stimulates RhoA and Cdc42 but not Rac1 GTPases. A, NIH3T3 cells were transfected with 100 ng of 5-HT7 receptor cDNA, 50 ng of pSRE.L, 50 ng of pCMV-β-gal, and 200 ng of C3 toxin cDNA. SRE activity was determined as described above. Presented data are the mean ± SEM (n = 4). A statistically significant difference between values is indicated (*p < 0.01). B, The 5-HT7 receptor activates SRE via RhoA and Cdc42. NIH3T3 cells were transfected with 50ng of pSRE. L, 50ng of pCMV-β-gal, and 100ng of 5-HT7 receptor cDNA together with 200 ng of each dominant-negative RhoA(N19), Rac1(N17), or Cdc42(N17) mutants as indicated. Activity of SRE was determined as described above. Presented data are the mean ± SEM (n = 3). A statistically significant difference between values is indicated (*p < 0.01). C-E, Rho GTPase activation assay. NIH3T3 cells growing on 100 mm dishes were transfected with 5 μg of RhoV14, RacV12, and Cdc42V12 together with the 5-HT7 receptor cDNA, serum starved, and then stimulated with 1 μm serotonin for 5 min. Rho GTPase activation assay was performed as described in Materials and Methods. C, RhoA activity was determined by the amount of RBD-bound RhoA (middle) normalized to the amount of RhoA in whole-cell lysates (bottom). D, Cdc42 activity was determined by the amount of PBD-bound Cdc42 (middle), normalized to the amount of Cdc42 in whole-cell lysates (bottom). E, Rac1 activity was determined by the normalization of amount of PBD-bound Rac1 (middle) to the amount of Rac1 in whole-cell lysates (middle). In parallel, expression of the 5-HT7 receptor was checked by the Western blots (top). Western blots from representative experiments are shown. F, The intensity of bands shown in C-E was quantified by densitometry, and the amount of active GTPase was normalized to the amount of the same GTPase in total cell lysates. Activities are shown as a fold increase compared with baseline and presented as means ± SEM from at least four independent experiments performed in duplicate. A statistically significant difference between values is indicated (*p < 0.01; **p < 0.001). Luc, Luciferase.