
Figure 2.
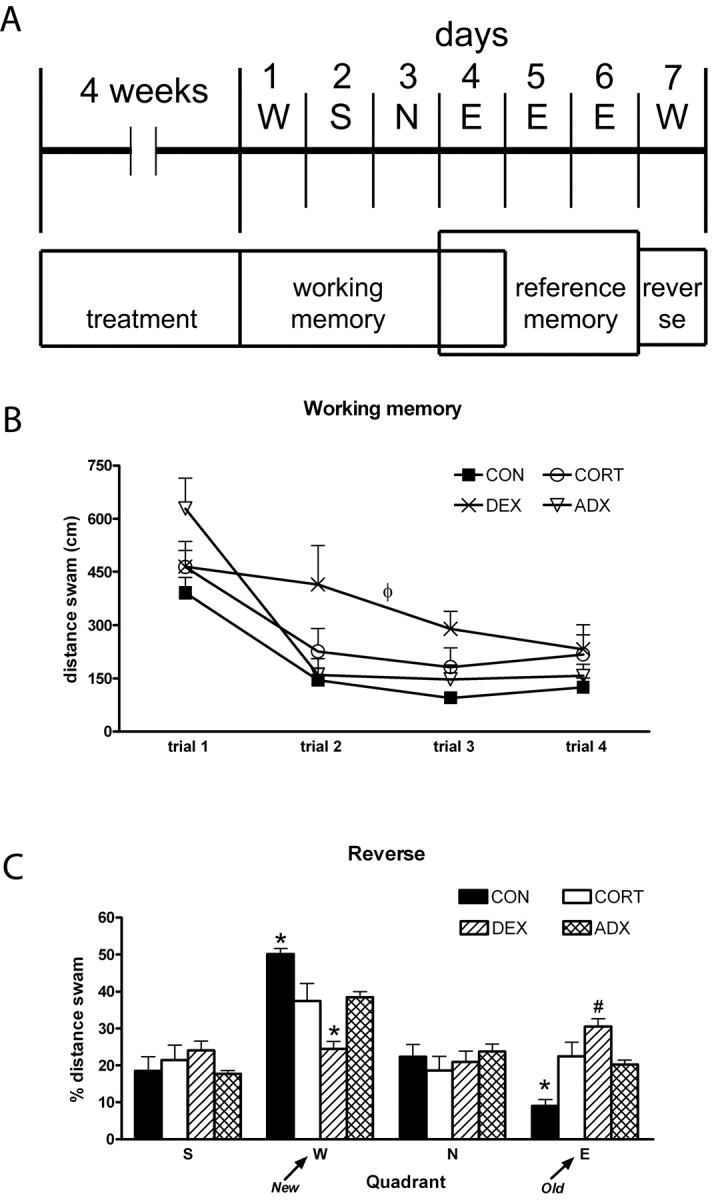
Behavioral data. A, Schematic representation of the experimental procedure. The position of the platform on each day is also indicated (above). Note that, during the 3 d allowed for memory consolidation (days 4-6), the platform was kept at the same position. B, Learning curve in the working memory task. The higher distances swum by the DEX-treated rats is easily appreciated. C, Results from the reverse task experiment: average distance swum on the four trials in each imaginary quadrant is given as a percentage of the total distance swum. *p < 0.05 versus all other groups; #p < 0.05 versus CON and versus ADX; ++p < 0.05 versus CON. Error bars represent SEM.