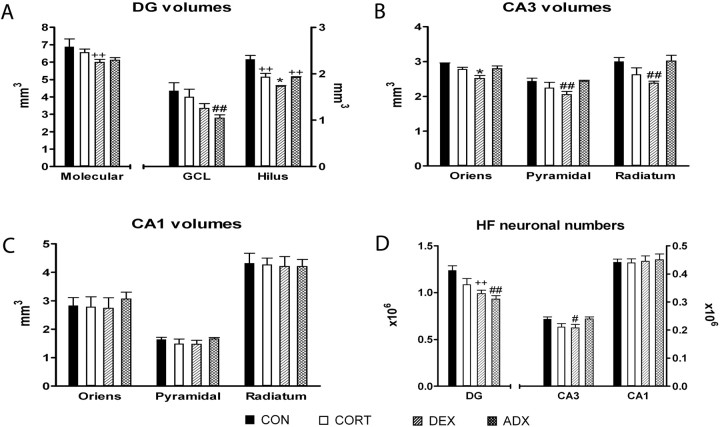
Figure 4.
Stereological data from the hippocampal formation. A-C, Mean volumes of the different layers of the dentate gyrus, CA3, and CA1 regions, respectively. D, Estimated number of neurons in the granule [dentate gyrus (DG)] and pyramidal (CA3 and CA1) layers. Note that, in A and D, the numerical values for the leftward bars (molecular layer and granule cell layer, respectively) should be read off against the axis on the left, whereas all other data should be read off against the right one. *p < 0.05 versus every other group; #p < 0.05 versus CON and versus ADX; ++p < 0.05 versus CON; ##p < 0.05 versus CON and versus CORT. Error bars represent SEM.

