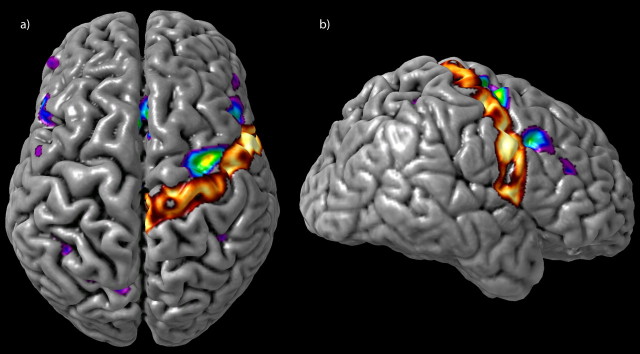
Figure 3.
The S2chords - noise - S1chords - noise group contrast and a 40% thresholded probability map of the right precentral gyrus, derived from the MNI International Consortium for Brain Mapping 152 subject normal cohort (Mazziotta et al., 2001), are overlaid onto a three-dimensional rendering of a single subject. This clearly illustrates the position of the peak shown in Figure 2d as lying anterior to the precentral gyrus in rostral area 6/caudal 8.

