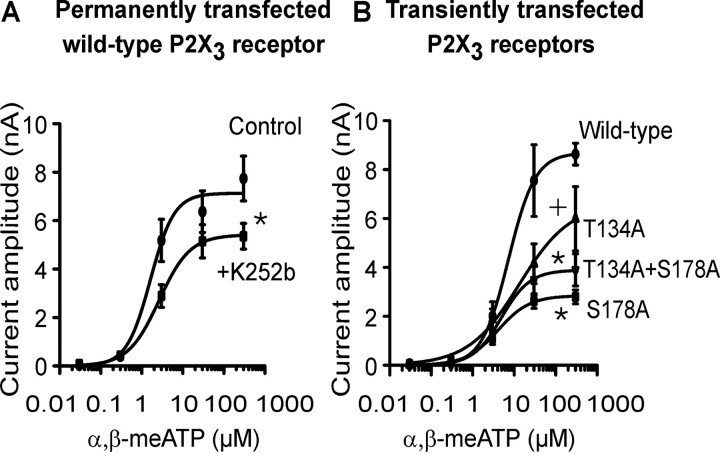
Figure 5.
Depression of α,β-meATP effects at wild-type hP2X3 receptor after ecto-PKC inhibition or mutation of consensus ecto-PKC phosphorylation sites. Although lower concentrations (0.03-0.3 μm) of α,β-meATP were superfused every 2 min, the higher concentrations (3-300 μm) were superfused every 5-7 min for 1 s each and onto the same HEK293 cell permanently or transiently transfected with hP2X3 receptors or their mutants T134A, S178A, and T134A+S178A. Mean ± SEM of five to seven experiments. A, Concentration-response curve for α,β-meATP in the absence and presence of K252b (2 μm). HEK293 cells permanently transfected with the wild-type hP2X3 receptor. Superfusion with K252b started 10 min before the first application of α,β-meATP and continued for the duration of the whole experiment. •, Control (Emax, 7127 ± 516 pA; EC50, 1.6 ± 0.6 μm; Hill coefficient, 1.5). ▪, K252b (0.2 μm) (Emax, 5411 ± 395 pA; EC50, 2.6 ± 0.8 μm; Hill coefficient, 1.2). *p < 0.05, statistically significant difference from the Emax value of the control curve. B, Concentration-response curve for α,β-meATP. HEK293 cells were transiently transfected with the hP2X3 receptor or its mutants T134A, S178A, and T134A+S178A. •, Wild-type (Emax, 8682 ± 858 pA; EC50, 7.3 ± 2.7 μm; Hill coefficient, 1.3). ▴, T134A (Emax, 6600 ± 1607 pA; EC50, 3.3 ± 1.4 μm; Hill coefficient, 0.7). ▾, T134A+S178A (Emax, 3889 ± 538 pA; EC50, 4.9 ± 3.0 μm; Hill coefficient, 1.3). ▪, S178A (Emax, 2842 ± 217 pA; EC50, 4.0 ± 1.3 μm; Hill coefficient, 1.1). *p < 0.05, statistically significant difference from the Emax value of the wild-type curve (comparison of all 4 groups). +p < 0.05, statistically significant difference from the Emax value of the wild-type curve (comparison of two groups). The EC50 values of the individual concentration-response curves in A and B did not differ from each other in a statistically significant manner.

