Figure 3.

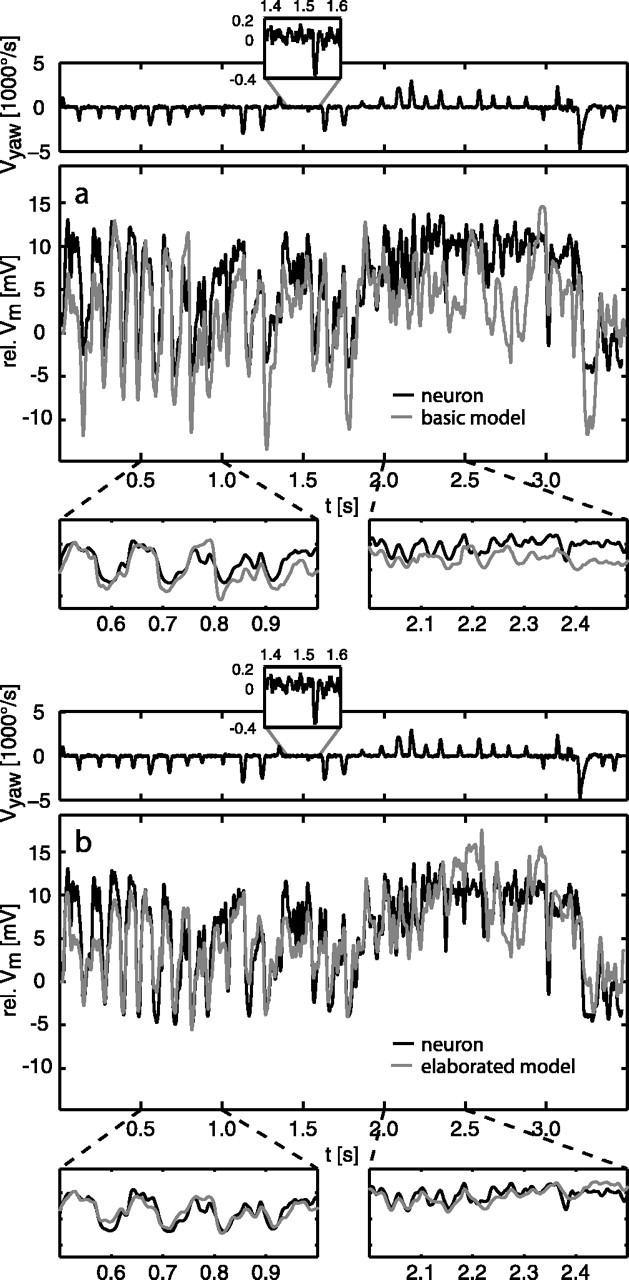
Examples of a model response (gray lines) of the basic (a) and elaborated (b) models compared with the neuronal response (black lines). Zoomed from the response traces are segments dominated by saccades inducing preferred-direction (right boxes) and null-direction (left boxes) motion, respectively. The yaw velocity of the fly's head is shown in the traces above the response; the insets show, at higher resolution, a section of the angular velocity trace with a small-amplitude saccade and a typical example of the yaw velocities between saccades (note the different scaling of y-axes). The model response was shifted in time by 22.5 ms to correct for neuronal delays not present in the model. rel., Relative.
