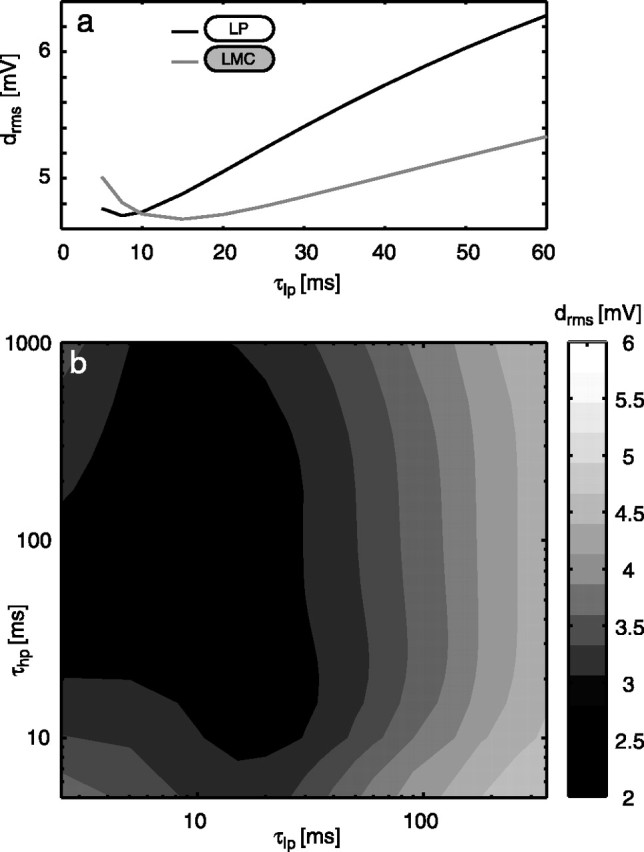
Figure 5.

Systematic variation of the time constants in the motion detector. a, Dependency of the rms difference between model and neuronal responses on the time constant of the basic model with a low-pass filter in the input lines to the motion detectors (black line; variant 1 in Fig. 4c) and an LMC kernel (gray line; variant 4 in Fig. 4c) as a peripheral element. Note the ordinate scale indicating that within a realistic range, the drms error does not depend on the time constants much. b, Dependency of the rms difference between model and neuronal responses on the two time constants of the ElMD (variants 5-7 in Fig. 4c). Average drms for all six stimuli is plotted as a contour plot.
