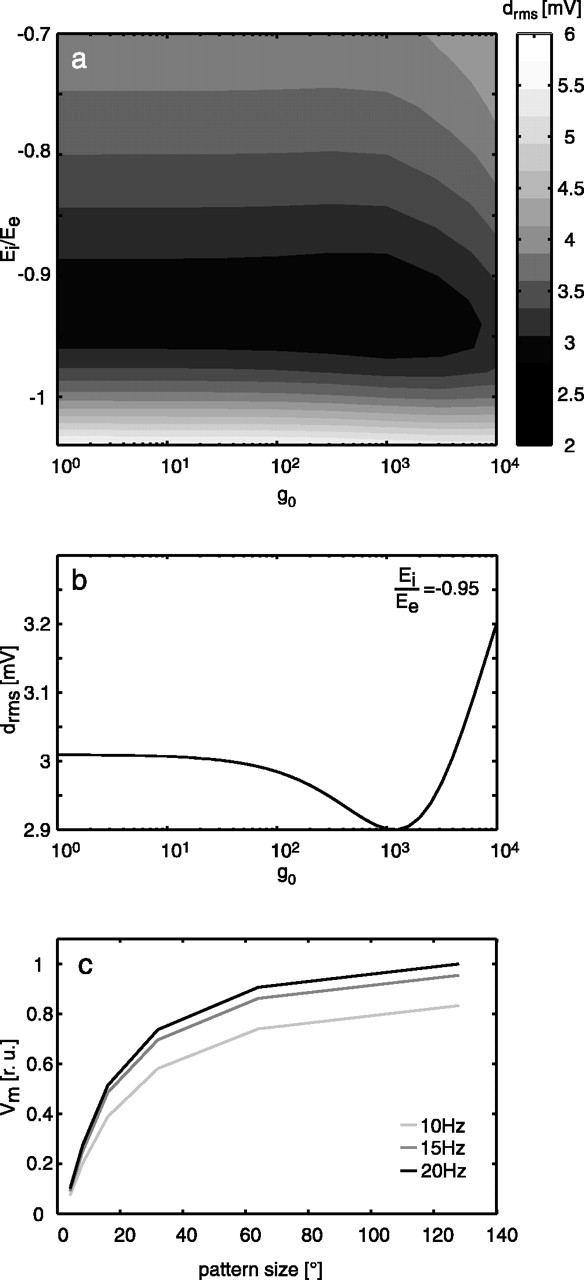
Figure 6.

Consequences of systematic parameter variation of the membrane model of the pooling neuron. a, Contour plot of the rms difference between model and neuronal responses depending on g0, Ei/Ee. The average drms of six stimuli is coded in gray levels. b,The rms difference between model and neuronal responses as a function of g0 only, Ei/Ee = -0.95. c, Steady-state response of the elaborated model (variant 7 in Fig. 4c) as a function of pattern size hinting at the gain control properties of the model neuron (see Results; sinusoidally modulated pattern; 10, 15, and 20 Hz temporal frequency; constant velocity motion; g0 = 1295).
