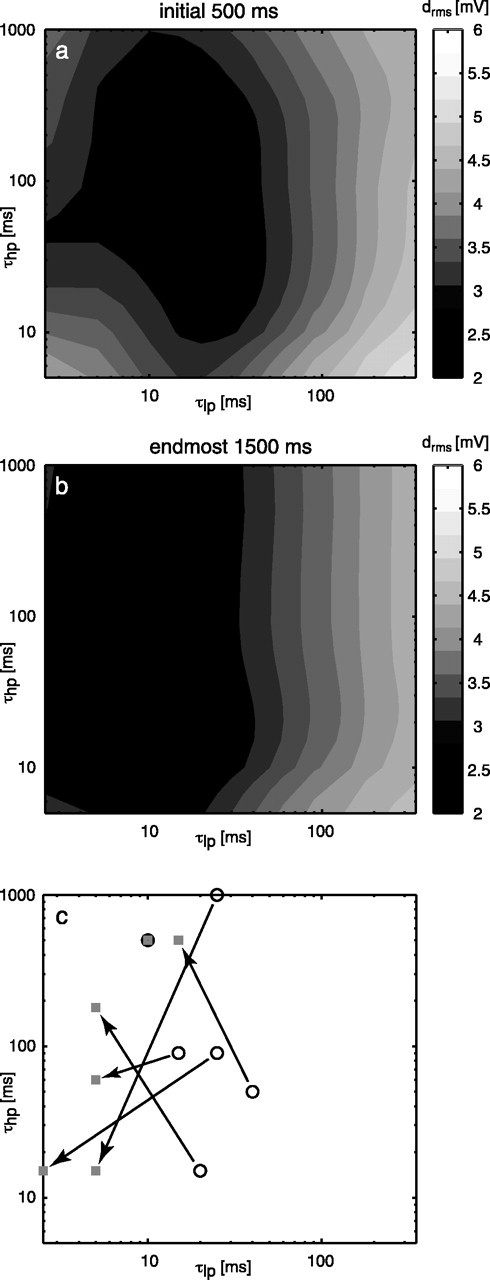
Figure 7.

Consequences of variations of τlp and τhp for the elaborated model (variant 7 in Fig. 4c) for an early and a late segment of the stimulus trace. The average rms difference between the model and the neuronal responses to six stimuli is coded in gray levels for the initial 0.5 s (a) and the endmost 1.5 s (b) of each stimulus. c, Optima for the time constants obtained when the model is parameterized separately for the different stimulus sequences. Circles show the optima for the initial 0.5 s, and squares show the optima for the endmost 1.5 s of the stimulus duration. The optima for a common stimulus are connected by arrows.
