Figure 1.
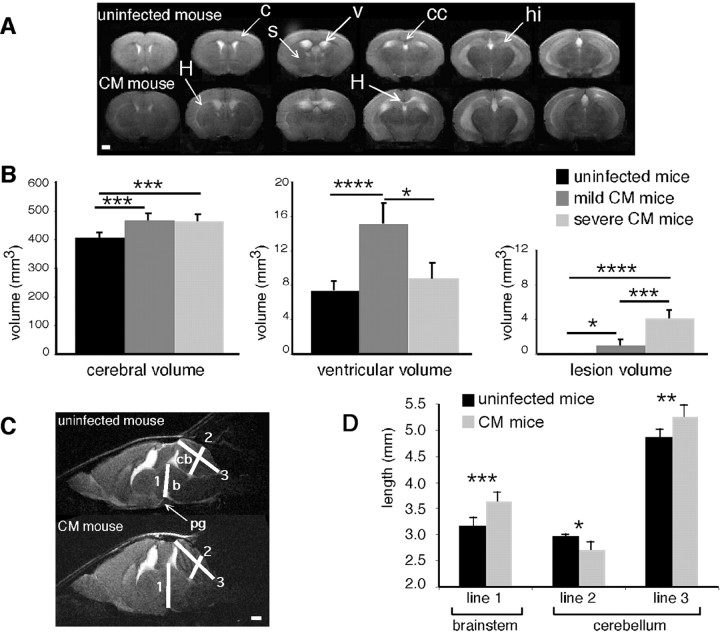
Assessment of brain swelling in mice with CM. A, Typical axial multislice T2-weighted MR images from an uninfected mouse and a mouse with CM (c, cortex; cc, corpus callosum; hi, hippocampus; s, striatum, v, ventricles). Note the areas of hyperintense signal in the striatum and corpus callosum (H). B, Total cerebral, ventricular, and lesion volumes from uninfected mice (n = 8), mice with mild CM (n = 8), and mice with severe CM (n = 5). C, Mid-sagittal T2-weighted MR images from an uninfected mouse and a mouse with CM. 1, Line going from the pituitary gland to the Sylvius aqueduct; 2, median line crossing the medial cerebellar nucleus; 3, median line stemming from the cerebellar obex (b, brainstem; cb, cerebellum; pg, pituary gland). D, Measurement of distances 1-3 from the mid-sagittal T2-weighted MR images of uninfected mice (n = 8) and mice with CM (n = 7). *p < 0.05; **p < 0.01; ***p < 0.005; ****p < 0.001. Scale bars: A, C, 1 mm.

