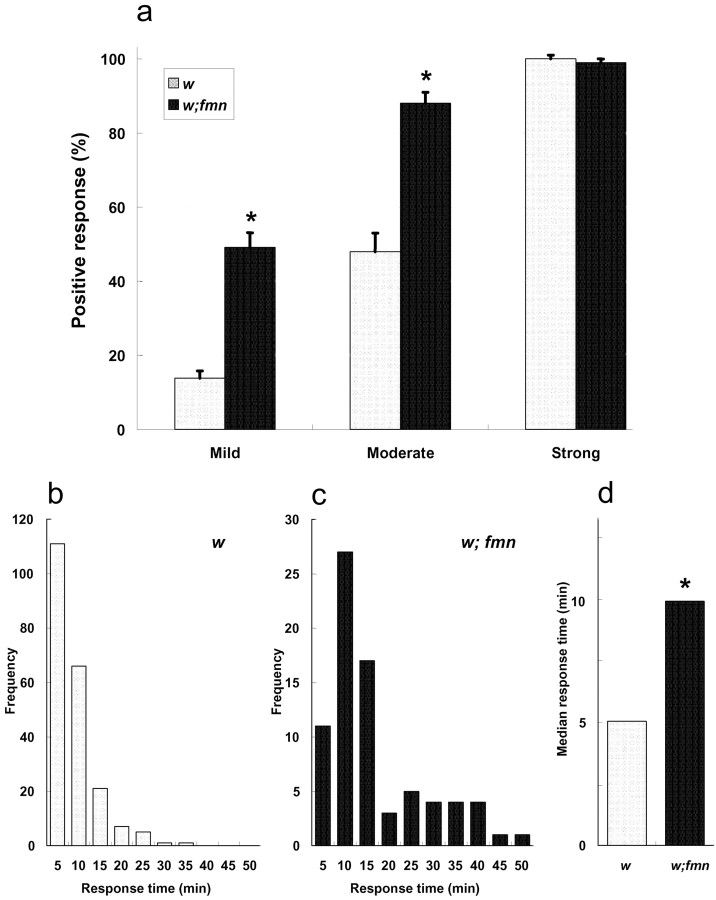
Figure 4.
fmn mutants show enhanced responses and prolonged response times to mechanical stimuli. a, Responses to mild, moderate, and strong stimuli. fmn mutants showed a larger response than wild-type control flies to both mild and moderate strength stimuli (n = 16 for both genotypes) b, c, Histograms of the distributions of response times in w and fmn flies. Frequency (y-axis) corresponds to the number of stimulated responses of the indicated durations out of the total number of responses. d, Average response times for both genotypes (from strong stimulation). fmn mutants show longer bouts of activity after stimulation. Error bars indicate the SEM. * indicates a statistically significant difference between w and fmn flies (Wilcoxon rank-sum test; p < 0.001).

