
Figure 2.
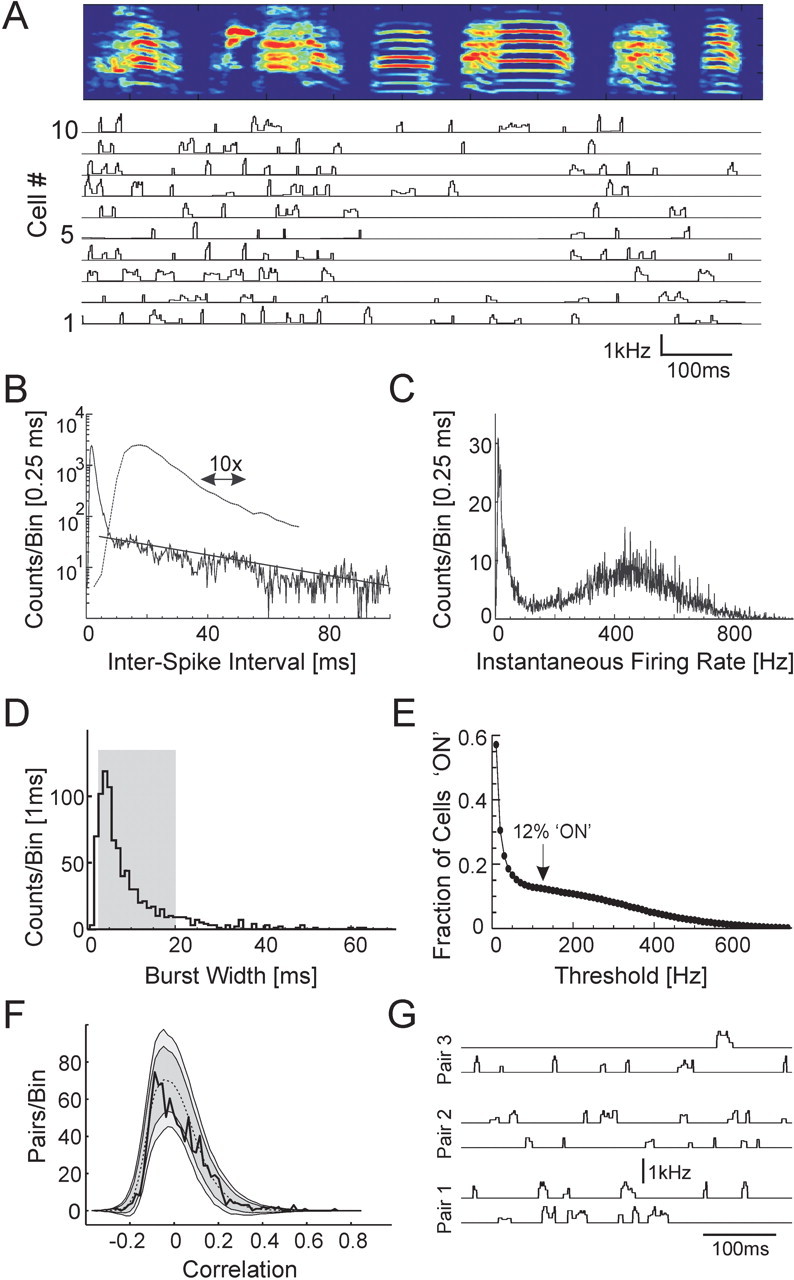
Statistics of RA firing patterns. A, Instantaneous firing rates of 10 RA neurons from bird 10 over the course of the song motif. RA neurons exhibit pronounced bursts with rapid onset and offset. At the top is the spectrogram of the bird's song. Note the reduction in RA burst density during the production of simple harmonic syllables versus complex nonharmonic syllables. B, Interspike interval histogram for all song-related RA spike trains (all birds; dashed line is a 10× zoom of the solid line). C, Distribution of instantaneous firing rates (all birds). D, Histogram of burst durations (threshold of 125 Hz; all birds). The mean burst length is 8.67 ms; the gray box marks the 10-90% interval. E, Average fraction of RA bursts with firing rates above threshold, as a function of threshold (all birds). Note the plateau at ∼125 Hz, with a fraction “on” of 12%. F, Distribution of correlations between all pairs of RA neurons recorded in each bird, accumulated across all birds (solid black line, 0.02 bin size; n = 946 pairs). The distribution for simulated data with randomly placed bursts is also shown (mean, dashed black line; ±2 SD, dark gray region; ±3 SD, light gray region). G, Instantaneous firing rate traces for three pairs of neighboring RA neurons in bird 9. Each pair was recorded simultaneously on the same microelectrode.