
Figure 4.
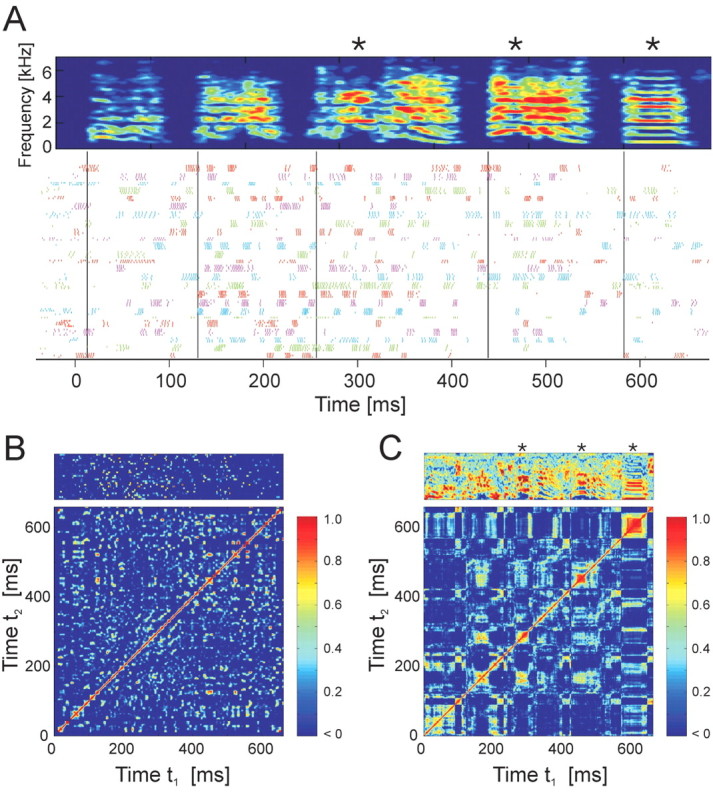
Correlation matrices of the RA population activity and song acoustic structure. A, Raster plot of song-aligned spike activity of 25 RA neurons recorded during singing in bird 12; cycled colors indicate different RA neurons as in Figure 1 B. The asterisks mark three syllables that are tracked in C and in Figure 5. B, Neural correlation matrix for the spike data shown in A. Each point (t1, t2) in the matrix represents the correlation of the pattern of neural activity at time t1 with that at time t2. The vector of neuronal firing rates is shown at the top. C, Song correlation matrix for the spectrogram shown in A. Each point in the matrix represents the correlation of the pattern of sound frequencies shown in the song spectrogram at time t1 with that at time t2. The normalized song spectrogram used in computing the song correlations is shown at the top.