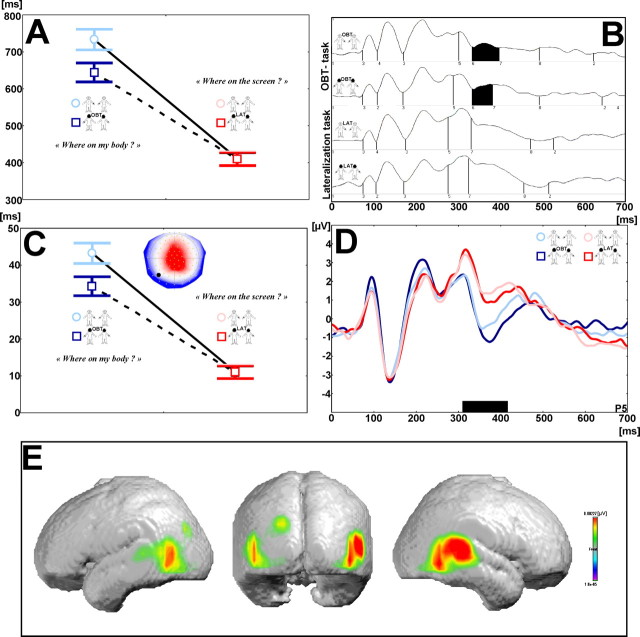
Figure 2.
Behavioral and evoked potential data during OBT task and lateralization task (healthy subjects). A, Reaction times in the OBT task (blue) and the lateralization task (red). On the left, the RTs (OBT task) are plotted separately for front-facing (light blue) and back-facing figures (dark blue). On the right, the RTs [lateralization task (LAT)] are plotted separately for front-facing (light red) and back-facing figures (dark red). Note the longer RTs for the OBT task. Front-facing figures during the OBT task, but not for the lateralization task, were characterized by longer RTs with respect to back-facing figures. B, Segments of stable map topography in the four experimental conditions under the global field power curve from 0 to 700 ms. Evoked potential segment 6 (segment shown in black) was found from ≈330 to 400 ms and only in the OBT task. C, Duration of evoked potential segment 6 (the respective map is shown in the right top corner of the figure) for the four experimental conditions for all participants. The duration of evoked potential segment 6 parallels the behavioral differences in the four experimental conditions. D, Evoked potential recorded at electrode P5 in the four experimental conditions showing differential coding between OBT (blue) and lateralization tasks (red) as well as between front-facing (light blue) and back-facing (dark blue) figures during the OBT task. The black bar estimates the time of differential coding between both tasks and is in agreement with the occurrence of evoked potential segment 6. E, Generators of evoked potential segment 6 (by inverse solution), which were localized bilaterally at the TPJ and predominated at the right TPJ.

