
Figure 3.
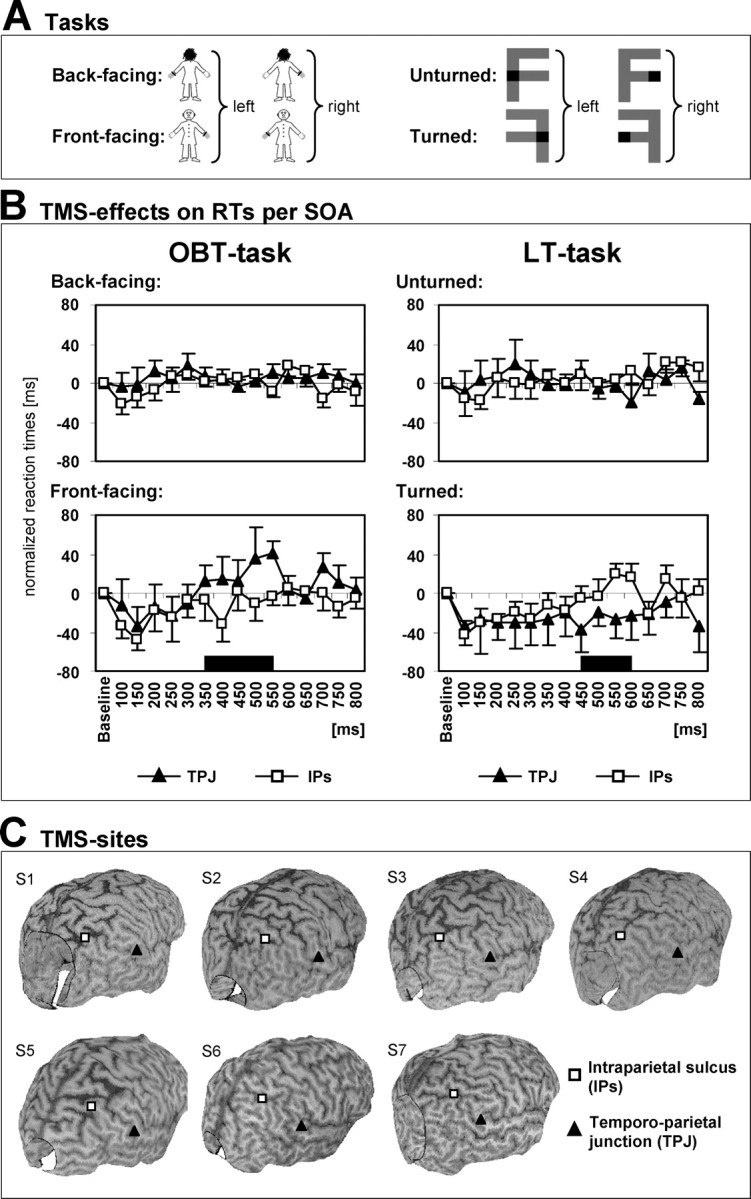
TMS data during OBT and LT tasks (healthy subjects). A, The different stimuli as used in the TMS experiment are shown. Correct responses are indicated to the right of each figure. The effects of TMS on the OBT task (human figures) and the LT task (letter F) were tested in a 2 × 2 block design (2 tasks × 2 TMS sites). B, Normalized RTs for the investigated TMS pulse delays (100-800 ms after stimulus onset) for OBT (left) and LT (right) tasks. The top figures plot the RTs for back-facing human figures (OBT task) and unturned letters (LT task) when TMS is applied over either TPJ (filled triangles) or IPS (open squares). The bottom figures show RTs for front-facing figures (OBT task) and turned letters (LT task) for the same TMS conditions. TMS neither of the TPJ nor of the IPS had any effect on performance to back-facing/unturned stimuli (top figures). TMS of the TPJ slowed RTs to front-facing figures (OBT task) relative to IPS stimulation when TMS was applied between 350 and 550 ms after stimulus onset (bottom left plot). This was concordant with the evoked potential data (time period is indicated by black bar). TMS over IPS, in contrast, increased RTs to turned letters (LT task) relative to TPJ stimulation at TMS pulse delays of 450-600 ms (bottom right plot). Error bars indicate SEs. C, TMS sites at the TPJ and IPS rendered over each subject's cortical surface plot constructed from the individual MRIs.