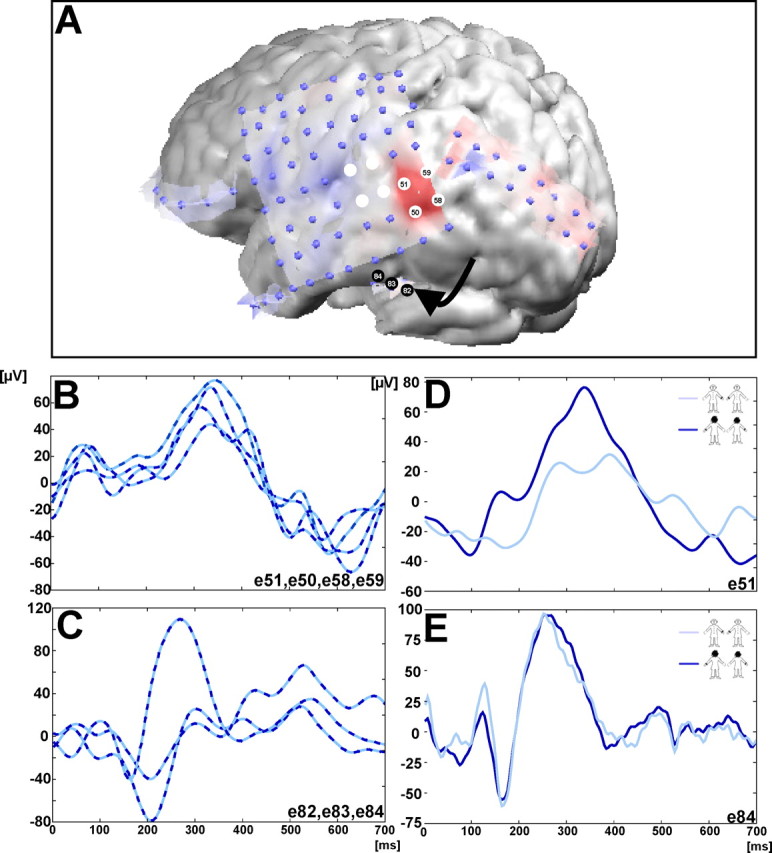
Figure 4.

Patient data. A, MRI with the implanted electrodes overlying the lateral convexity of the left hemisphere. The epileptic focus, for which the discharge induced an OBE, is indicated by the eight white electrodes at the TPJ. iEP amplitude (in microvolts) for all implanted electrodes during the OBT task at ∼333 ms (blue depicts positive values and red depicts negative values). B, The most prominent iEPs at this latency were recorded at electrode sites 50, 51, 58, and 59 over the TPJ and partly overlapping with the epileptic focus (A). C, Three iEPs during the OBT task, which were recorded in the basal temporal region (indicated by the arrow in A). Although iEPs at these electrode sites were also prominent, they were recorded at a different latency (∼270 ms). Importantly, as shown in E, the amplitude of these basal temporal iEPs did not differ for front-facing (light blue) and back-facing (dark blue) figures, whereas the amplitude of the iEPs at the TPJ did (D). The electrode site for each figure is given in the bottom right corner of each panel.
