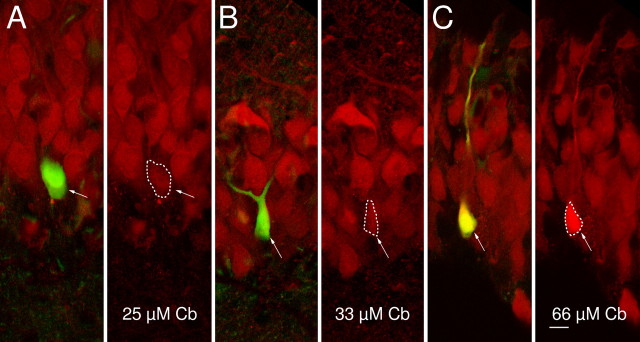
Figure 3.
Purified calbindin-D28k (Cb) in the patch pipettes rescues immunoreactivity after prolonged whole-cell recordings.A, The granule cell shown was recorded with a pipette solution containing LY and 25 μm purified calbindin-D28k. The arrow indicates the recorded granule cell. The dashed line denotes the area that was used to quantify the mean calbindin-D28k-related fluorescence of this cell. Notice that the loss of immunoreactivity as observed in Figure 2 is clearly prevented. The immunoreactivity of this recorded cell is slightly lower than that of neighboring granule cells. For comparison, the brightness of the red color (Cy5) has been decreased in A and B such that the surrounding granule cells appear similarly bright between A-C. A low level of brightness had to be chosen to avoid saturation of the intensity of the granule cell in C. Left, Confocal scans of LY and of calbindin-D28k (Cy5) fluorescence are merged into one image. The arrow indicates the recorded granule cell. Right, Calbindin-D28k (Cy5) fluorescence only. B, As in A, but the cell was filled with 33 μm calbindin-D28k. The recorded cell appears as bright as the neighboring cells, indicating that the patch pipette contains the same concentration of calbindin-D28k as surrounding granule cells. C, As inA, but the recording electrode contained 66 μm calbindin-D28k. This concentration caused an immunofluorescence that is clearly higher than that of surrounding granule cells. Scale bar (applies to A-C), 10 μm.

