Figure 5.
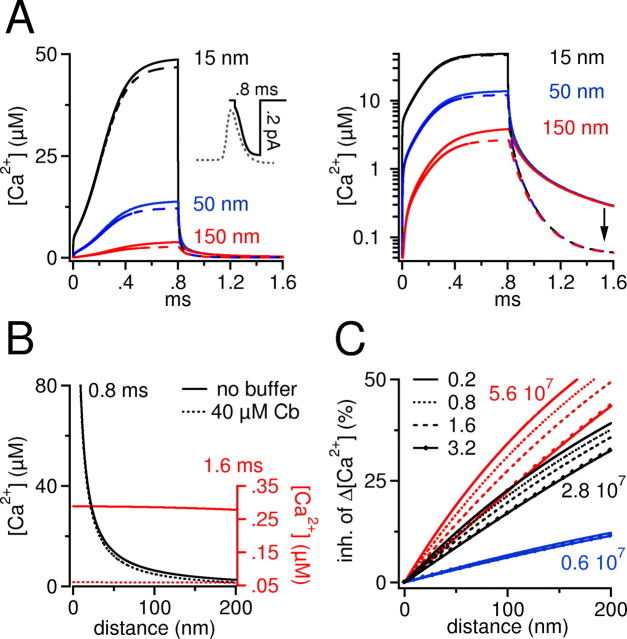
Numerical simulation of buffered Ca2+ diffusion around a single Ca2+ channel. A, Left, Time course of free Ca2+ after opening and closing of a single Ca2+ channel in the absence and presence of calbindin-D28k at three distances from the channel (15, 50, and 150 nm). The channel opens at 0 ms and closes at 0.8 ms. The inset shows the time-dependent variation of the simulated single-channel current according to the varying driving force during repolarization of the action potential. For comparison, an action potential is aligned on the same time scale (gray dotted trace). Calbindin-D28k exerts a distance-dependent inhibition on free Ca2+. A notable percentage reduction of free Ca2+ is observed only at a distance of 150 nm. In contrast, calbindin-D28k strongly reduces free Ca2+ after closure of the channel. This is best seen in the right panel, where data are plotted on a semilogarithmic graph. The arrow indicates the prominent reduction in Ca2+ when the channel has closed. The single-channel open time chosen here signifies an upper limit, because most Ca2+ channels would close earlier (Lee and Elmslie, 1999) during the repolarization phase of an action potential. B, Radial gradient of action potential associated free Ca2+ reached around the channel after 0.8 ms (black lines) and after 1.6 ms (when the channel is closed for 0.8 ms, red lines). The continuous lines denote the Ca2+ profile in the absence of calbindin-D28k (Cb); the dashed lines denote the Ca2+ profile in the presence of calbindin-D28k. Black lines, A steep Ca2+ gradient is present that reaches >80 μm close to the channel. It can be seen that close to the channel (<30 nm), the black line and the black dotted line superimpose, indicating that free Ca2+ is hardly affected by calbindin-D28k. Red lines, The Ca2+ gradient has collapsed, and a residual Ca2+ concentration is effectively removed at all distances through shuttling by calbindin-D28k. Ca2+ concentration for red lines is indicated by the right axis, which is scaled up for clarity. Note that the resting Ca2+ concentration (50 nm) of the left and the right axis are on the same level. Distance indicates the distance from the Ca2+ source. C, Radial gradients of the percentage inhibition of the increase in Ca2+ above resting Ca2+ (Δ[Ca2+]) caused by calbindin-D28k at the end of a 0.8-ms-long channel opening. For each condition, we ran the simulation for 0.8 ms and calculated a radial profile of the percentage inhibition of ΔCa2+ at the end of the channel opening as shown by black lines in B. Three different families of curves are plotted (red, black, and blue) that represent three different values of kon (indicated by small numbers, in M-1s-1). Within each of the three families, we varied the single-channel current amplitude as coded by the mode of the lines (0.2, 0.8, 1.6, and 3.2 pA; see key). At 15 nm, the concentration of Ca2+-bound calbindin-D28k increased at 0.8 ms by ∼8 μm (0.2 pA) and by ∼100 μm (3.2 pA). It should be noted that the percentage inhibition plotted here represents an upper estimate, because no other competing buffer is included in the model. If, for example, a 500 μm concentration of a fixed buffer with a relatively fast on-rate (kon = 1 × 10⁸ m/s; KD = 50 μm) is present, then the inhibition caused by addition of calbindin-D28k will be reduced by a factor of 2.

