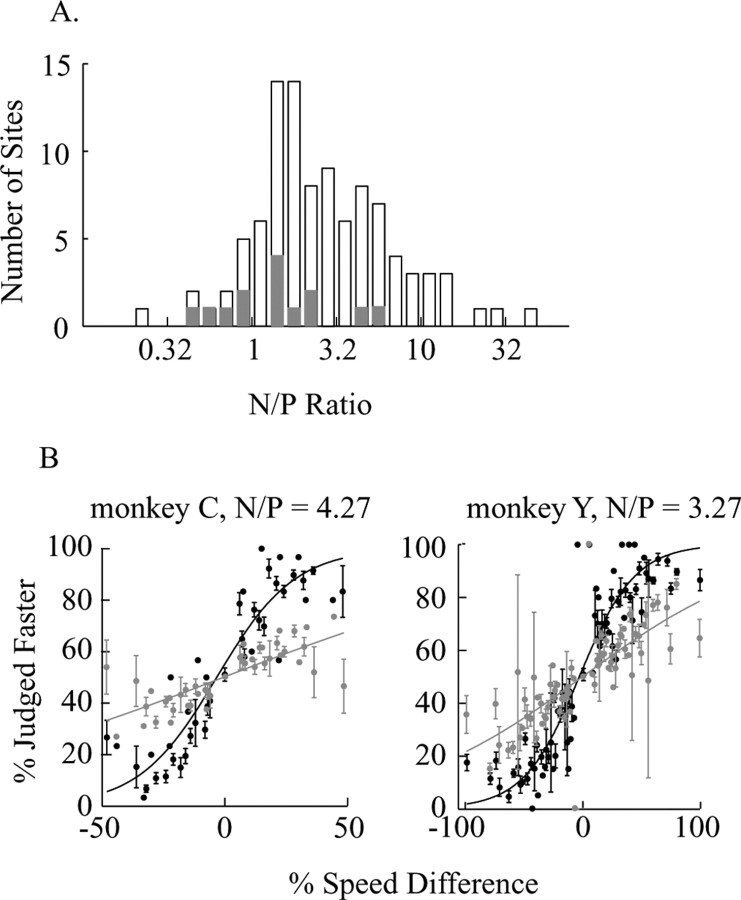
Figure 10.
A, Frequency histogram of the relationship between neurometric and psychometric thresholds across all experiments. Data are depicted as threshold ratios (neuronal/psychophysical, N//P) and plotted in logarithmic scale for convenient visualization. Solid bars indicate SUs; the rest are MUs. B, Population psychometric (black data points and black curve) and neurometric (gray data points and gray curve) performance for the two monkeys. The mean and SE of psychometric performance and neurometric performance was plotted at each speed difference, and the population data were fitted with logistic regression.

