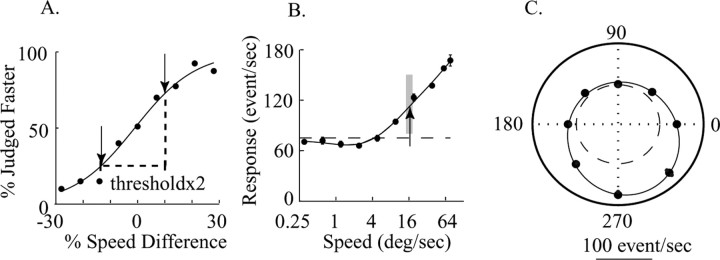
Figure 2.
A, Psychophysical performance in one block of trials. The plot depicts the percentage of trials in which the monkey indicated that the speed in MT RF was faster as a function of the speed difference between the two apertures (relative to the slower speed of the two). Positive speed differences indicate that the stimulus inside the MT RF moved faster; negative speed differences indicate the converse. Perceptual threshold was 12.4% speed difference in this block. The reference speed for this experiment was 16°/s. B, The MU speed-tuning curve of the MT site under study while the monkey produced the behavioral data in A. The preferred speed is 76.8°/s. The arrow indicates the reference speed, and the gray box indicates the range of speeds used in the discrimination task. C, The direction-tuning curve of the same site, with a preferred direction of 289°. The dashed line indicates the spontaneous activity.

