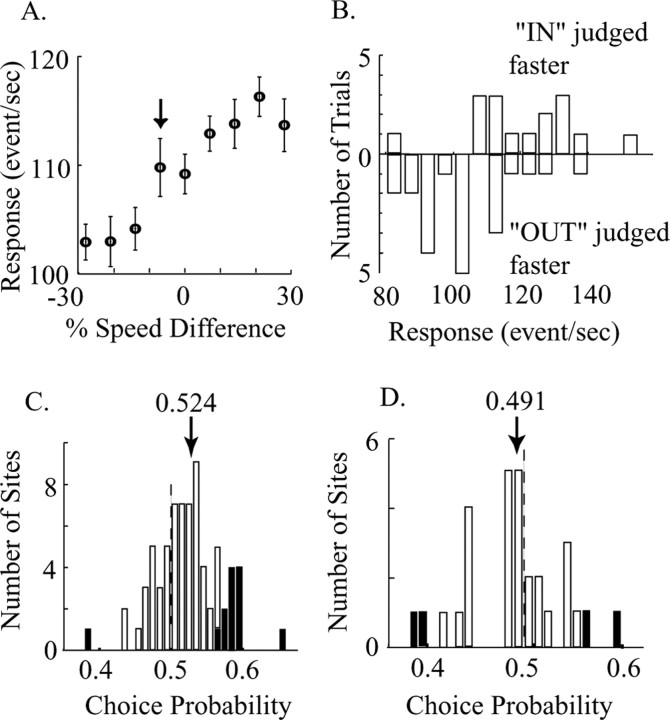
Figure 5.
Computation of choice probabilities. A, Average firing rates and the SEs for the same experiment depicted in Figure 2 A. The MU speed- and direction-tuning curves for this site are shown in Figure 2, B and C. B, Distributions of firing rates for one trial type, in which the speed in RF was 7% slower than the speed outside RF (A, arrow). The two distributions (upward vs downward bars) are segregated on the basis of the monkey's decision on each trial. C, Frequency histogram of choice probabilities for sites in which the reference speed was positioned on the ascending shoulders of the tuning curves. The solid bars indicate sites for which the choice probability is significantly different from 0.5. The mean is 0.524 (n = 72 sites). D, Frequency histogram of choice probabilities for sites in which the reference speed was positioned on the descending shoulders of the tuning curves. The mean is 0.491 (n = 29 sites).

