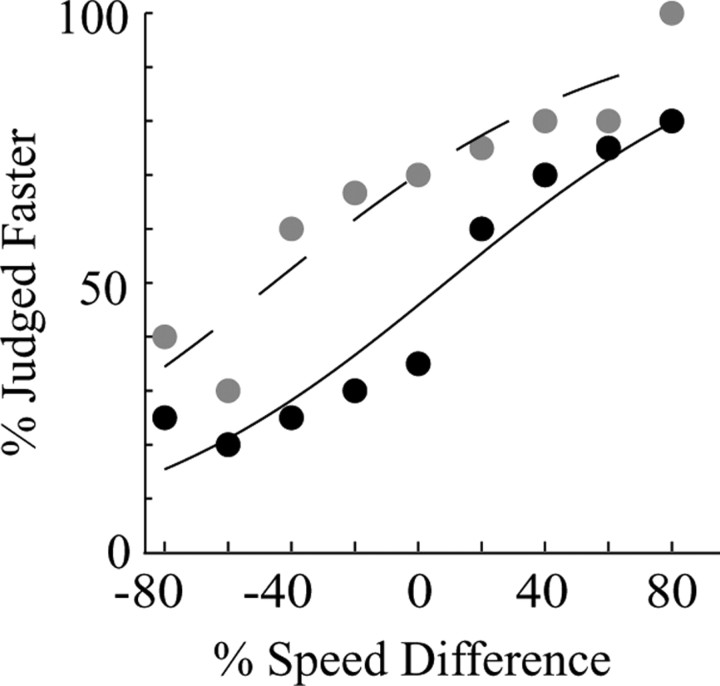
Figure 7.
An example microstimulation effect produced at one MT site. The black data points and solid curve show the monkey's behavioral choices in the absence of microstimulation; the gray data points and the dashed curve show choices in the presence of microstimulation. Axis conventions are as in Figure 2 A.

