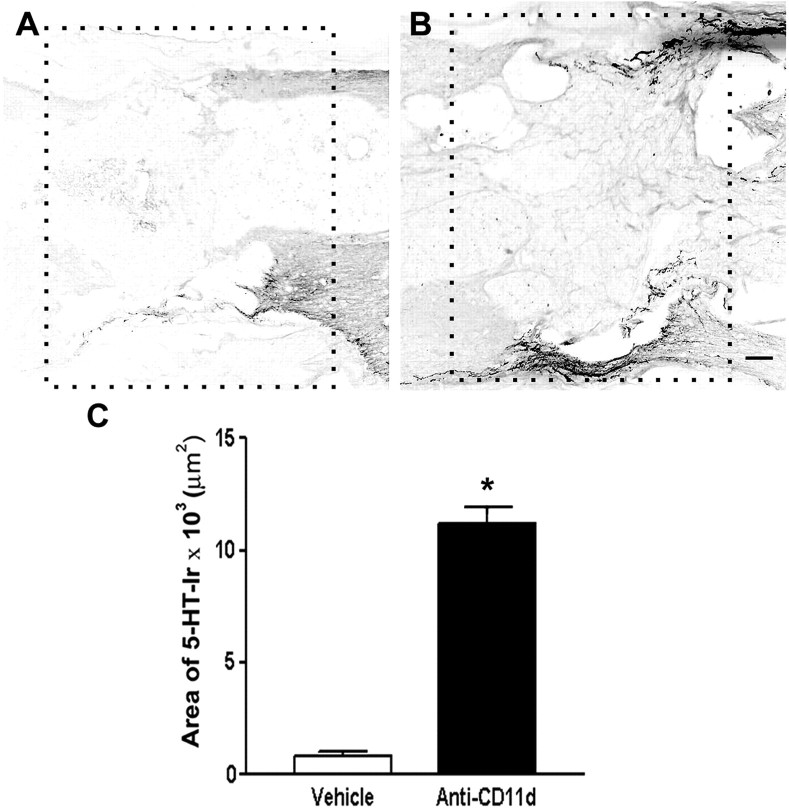
Figure 7.
Serotonergic fiber density in and adjacent to the lesion site in vehicle-treated (n= 4) and anti-CD11d mAb-treated (n = 3) rats. Low-power photomicrographs of the lesion areas analyzed in the vehicle- and mAb-treated rats are outlined with boxes in A and B, respectively. The rostral side of lesion is on the right of photomicrographs. Images have been reversed to black on white to reveal details of lesion structure. Scale bar, 200 μm. C, Graph illustrates mean area of immunoreactivity for 5-HT within the lesion in vehicle- and mAb-treated rats. Data are expressed as mean values ± SEM. *p < 0.05 compared with vehicle-treated rats.

