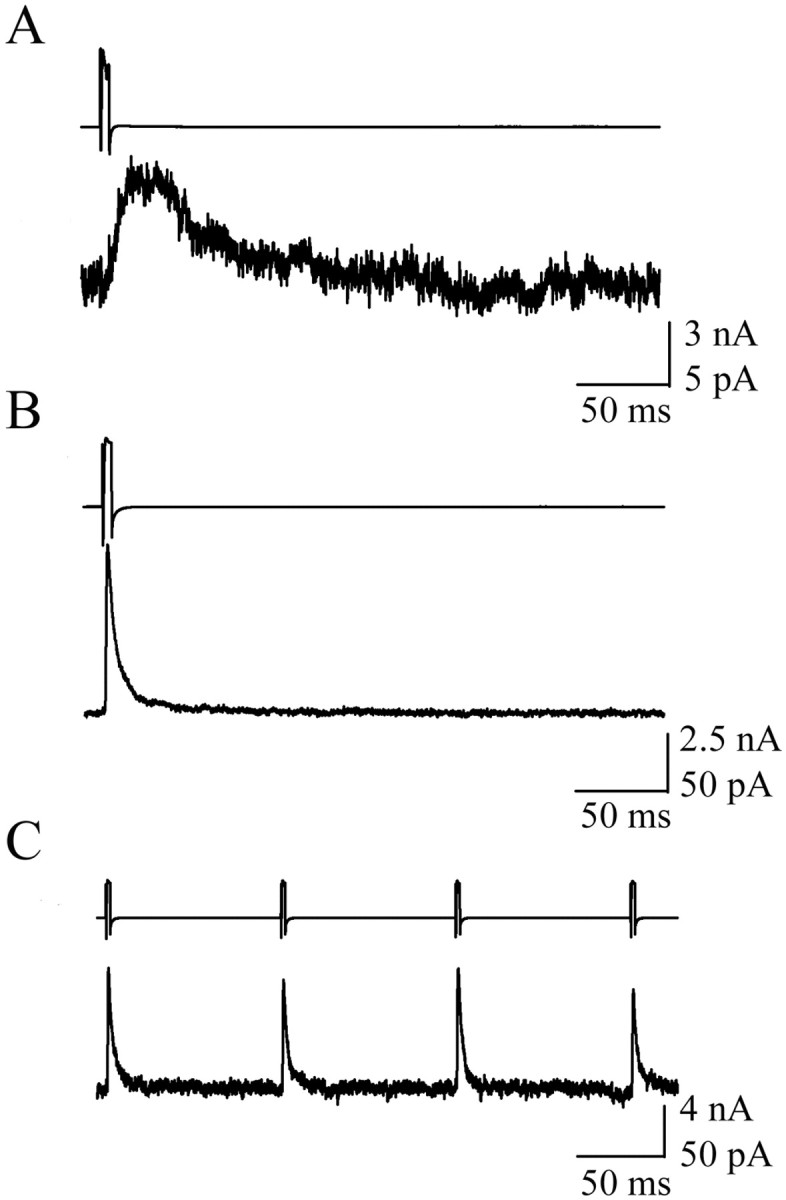
Figure 10.

Synapses between NG and non-NG cells of the CA1 SLM. A, Voltage-clamp recording showing the slow IPSC recorded in a non-NG cell after NG cell stimulation. B, Stimulation of a non-NG cell resulted in a fast IPSC being recorded in the NG cell. C, Stimulation of a non-NG cell at 5 Hz resulted in a train of nondepressing IPSCs being recorded in the NG cell. The top traces illustrate presynaptic action currents, and the bottom traces illustrate unitary postsynaptic IPSCs. Each trace is the average of 10 sweeps.
