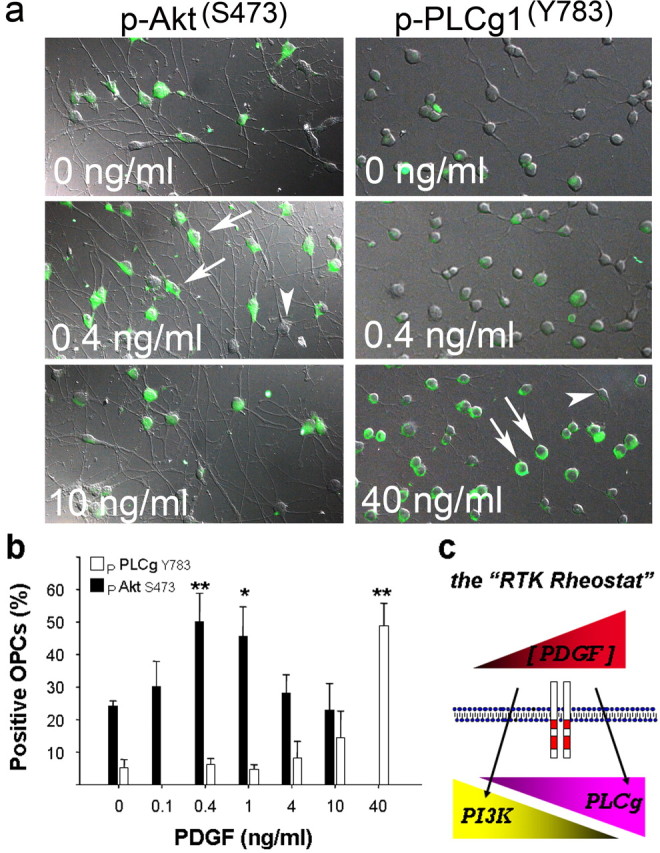
Figure 7.

Activation of PI3K and PLCγ at distinct ligand levels. a, Phosphorylation of Akt serine 473 (left) and PLCγ1 tyrosine 783 (right) in OPCs exposed to PDGF-AA. Activation was scored as positive for individual cells in which immunoreactivity was concentrated at the plasma membrane (arrows) and negative if diffuse or nondetectable (arrowheads). b, Dose-dependent phosphorylation of Akt and PLCγ; the maximal response observed was at 0.4 ng/ml PDGF for Akt (filled bars) and 40 ng/ml for PLCγ1 (open bars). Values are mean ± SEM from four independent trials with 200-400 cells per condition, and asterisks indicates a significant difference from mock-treated control cultures (*p < 0.05; **p < 0.01). c, The RTK rheostat; the top symbol depicts relative extracellular ligand levels (low to high, in arbitrary units), and the bottom symbols depict the activation of PI3K and PLCγ at distinct ligand levels. The model predicts that, at low levels, PDGFRα uses PI3K (which promotes proliferation and chemotactic migration), whereas at high levels, PDGFRα engages PLCγ (which promotes proliferation but is not required for migration). The model offers a simple mechanism for how OPCs generate directional migration and sustained proliferation in a gradient of PDGF (see Discussion).
