
Figure 3.
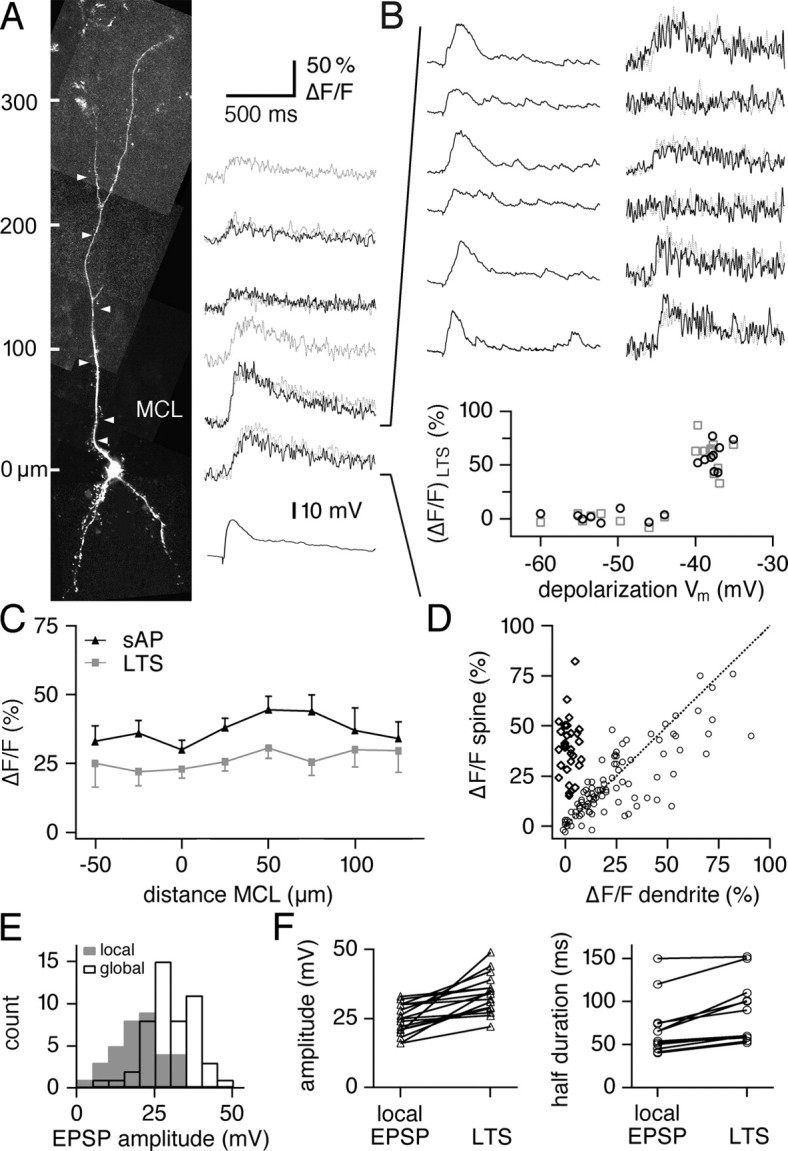
Large EPSPs evoked by glomerular stimulation cause global Ca2+ influx. A, Left, Scan of an individual granule cell with locations of line scans (white arrowheads). MCL marks the position of the mitral cell layer. Right, Averaged line scans of ΔF/F transients in spines (black) and dendrites (gray) recorded at the locations marked to their left. The black trace at the bottom shows the averaged EPSP recorded at the soma. B, Consecutive individual EPSPs and corresponding line scans recorded at the most proximal location. Calibration as in A. Note the correlated fluctuations in EPSP amplitude and ΔF/F transient amplitudes. The bottom plot summarizes the amplitudes of all ΔF/F transients at this location versus the maximal depolarization obtained by the concomitant EPSPs. C, Averaged ΔF/F transients caused by LTSs (gray markers) and sAPs (black markers), binned according to the distance of the recording site to the mitral cell layer. Data are from 48 cells and 137 dendritic locations. The analogous profiles for spines do not differ significantly. D, Scatter plot of all mean response amplitudes (ΔF/F)LTS (open circles) and (ΔF/F)syn (diamonds) in spines versus the respective adjacent dendrites. E, Distribution of all mean EPSP amplitudes used in the experiments. The gray bars represent cells in which only local responses were found, and the white bars represent cells in which a global LTS signal was observed. F, Changes in mean EPSP amplitude and half-duration that accompanied stochastic fluctuations between EPSPs that were linked to global LTS calcium signals and those that were not, at constant stimulation strength (as in B). n = 12 cells, several EPSPs averaged for each condition.