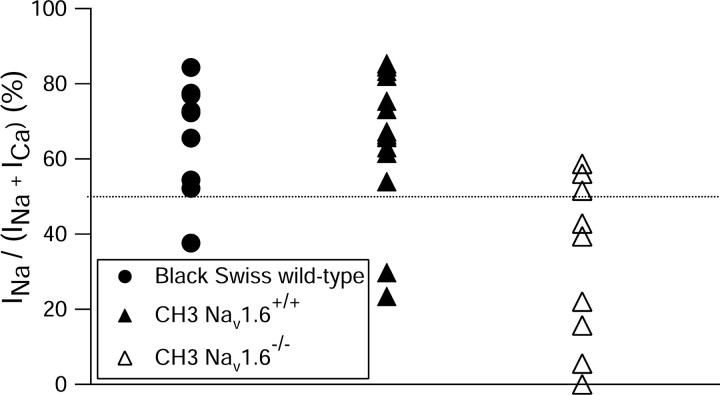
Figure 8.
Relative magnitude of inward current from sodium channels and calcium channels between the first two spikes in bursts in individual cells from Nav1.6+/+ animals and Nav1.6-/- animals. The y-axis plots the fraction of total inward current in the interspike interval carried by sodium channels. The sodium current and calcium current during the first interspike interval were determined in each cell in action potential clamp experiments using the action potential of each cell as in Figure 1. Filled circles, Cells from series of experiments using Black Swiss mice; closed triangles, cells from wild-type littermates of Nav1.6-/- mice (CH3 strain background); open triangles, cells from Nav1.6-/- animals.

