
Figure 1.
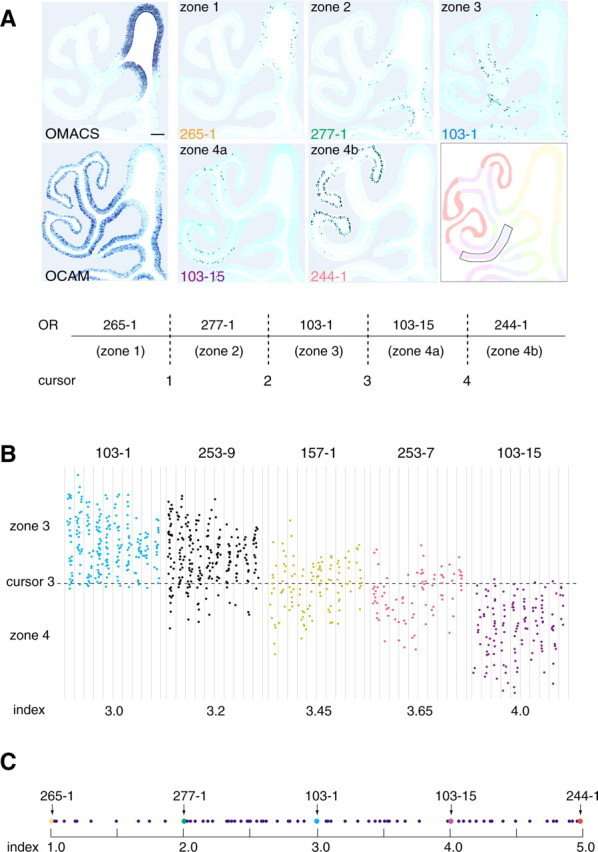
In situ hybridization of the mouse OE sections. A, Conventional OE zones are represented by the following standard OR genes: MOR 265-1 (zone 1), 277-1 (zone 2), 103-1 (zone 3), 103-15 (zone 4a), and 244-1 (zone 4b). Zone 4 was subdivided into two subzones, 4a and 4b, to calculate zone indices for the zone 4 OR genes. Four cursor lines, 1-4, were placed between the two neighboring zones or subzones as shown. The expression of the OMACS gene that codes for the olfactory-specific medium-chain acyl-CoA synthetase (Oka et al., 2003) was used as a marker for zone 1. Zone 1 is also defined as an OCAM-negative zone by in situ hybridization. Scale bar, 100 μm. B, Distribution of hybridization signals. Five OR genes, MOR 103-1, 253-9, 157-1, 253-7, and 103-15, expressed in zone 3 and/or zone 4 are analyzed. The zone 3-4 regions (boxed in the diagram of A) in every sixth coronal section (8 μm thick) were examined from the anterior-to-posterior direction (left to right). Hybridization signals were plotted on the unrolled maps of the OE region along endoturbinate II and ectoturbinate 2′. The zone index of each OR gene was calculated as a ratio of hybridization signals in two neighboring zones. For example, MOR 253-9, for which the zone index was 3.2, showed 20% of total signals in zone 4a and 80% in zone 3. C, Distribution of zone indices. A total of 80 different OR genes were analyzed. Zone indices for the standard OR genes are indicated by arrows. The scale does not reflect the physical distances between the neighboring zone boundaries.